Are self rated players bumped up more than others?
Part 6, USTA Adult Tennis League by the Numbers, 2017
The previous post showed that about 15% of all USTA tennis league players were either bumped up or down. Let's see what percentage of those players were self rated.
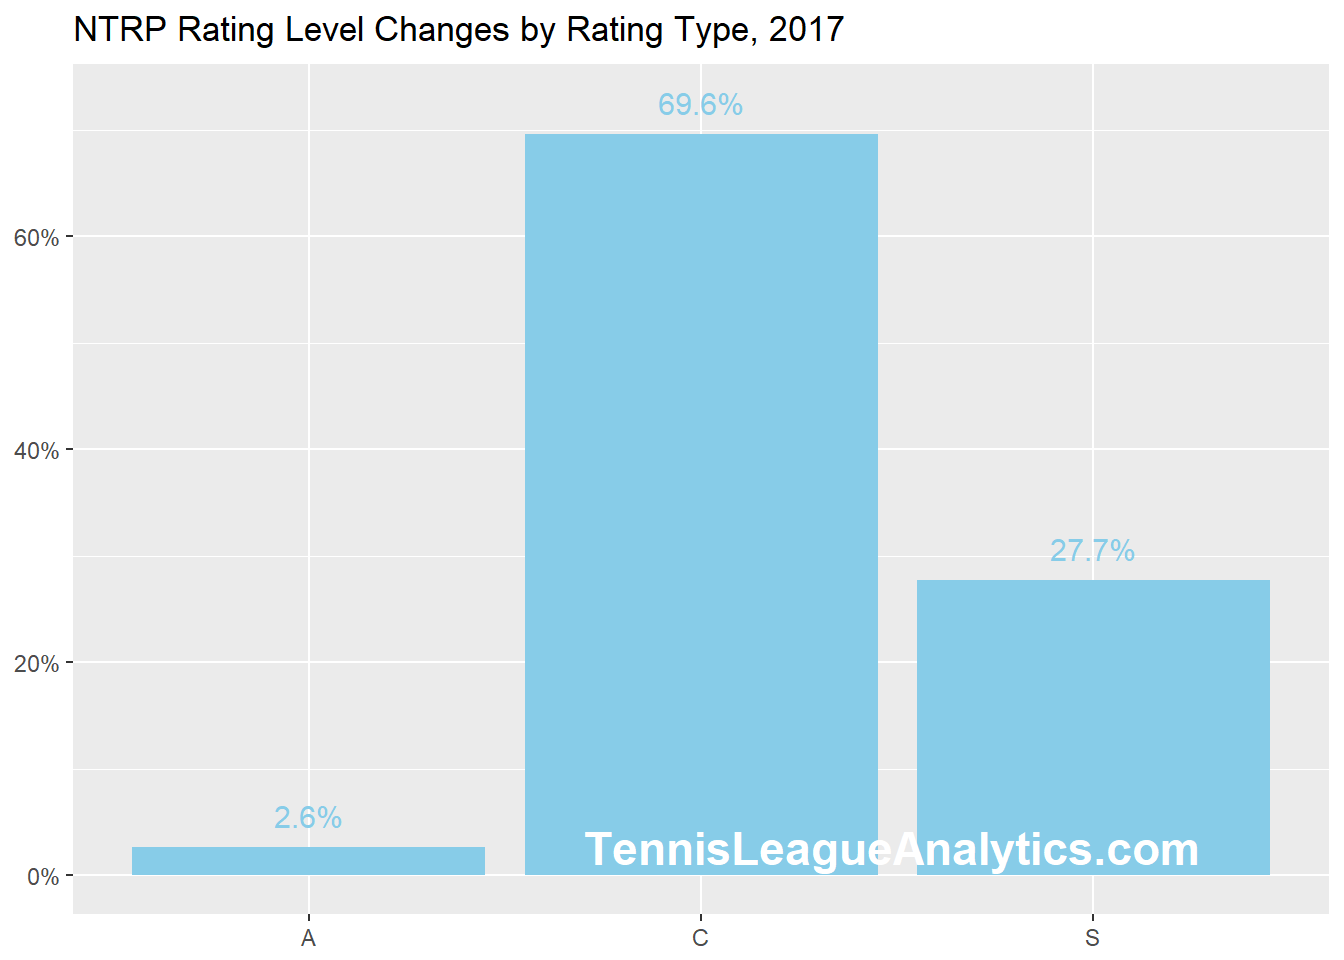
The graph shows the percentage of players with an NTRP level change by three rating types:
- A: Appeal
- C: Computer
- S: Self-rated
There are three additional rating types with numbers small enough to ignore. You can see the full list of rating types at this helpful USTA FAQs page.
Of the 44,000 players bumped up or down, 28% (about 12,000) were self rated. Does this percentage change when we look only at bumped up players?
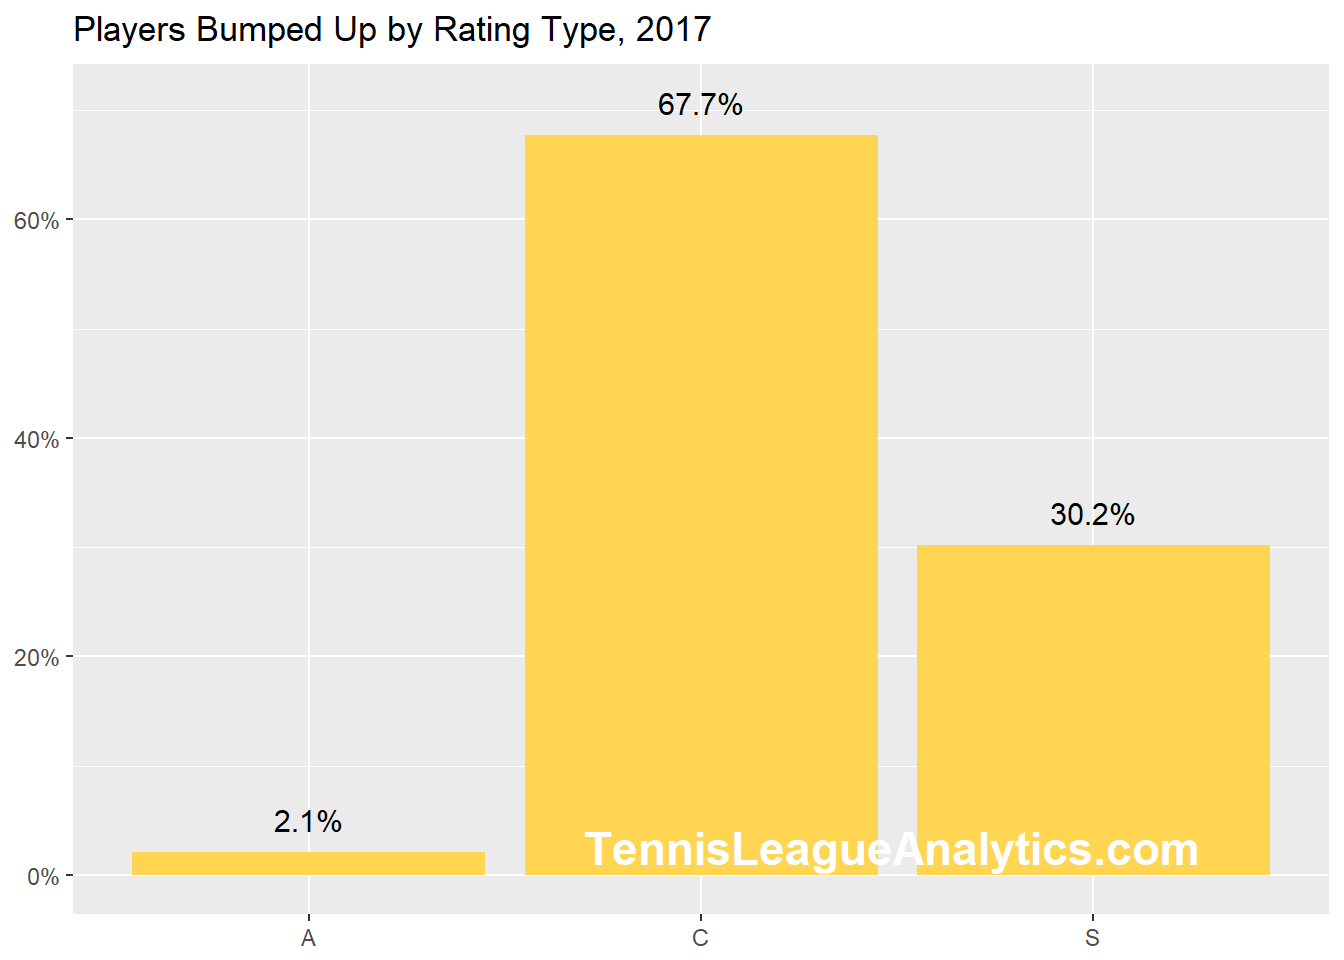
So far, it does not look like self rated players are bumped up more than others. But there's an additional important point to consider - How many players are Computer vs Self rated? We'll look at this in the next post.
If you like this type of info, let your tennis friends know about TLA. Email your questions or contact us via Twitter or Facebook.
Follow us on Twitter, Facebook, or subscribe to our mailing list for updates.
Where do you rank in USTA matches played?
Part 4, USTA Adult Tennis League by the Numbers, 2017
We've had several questions along the lines of "Where does my number of matches played rank?" This post will focus on this one question.
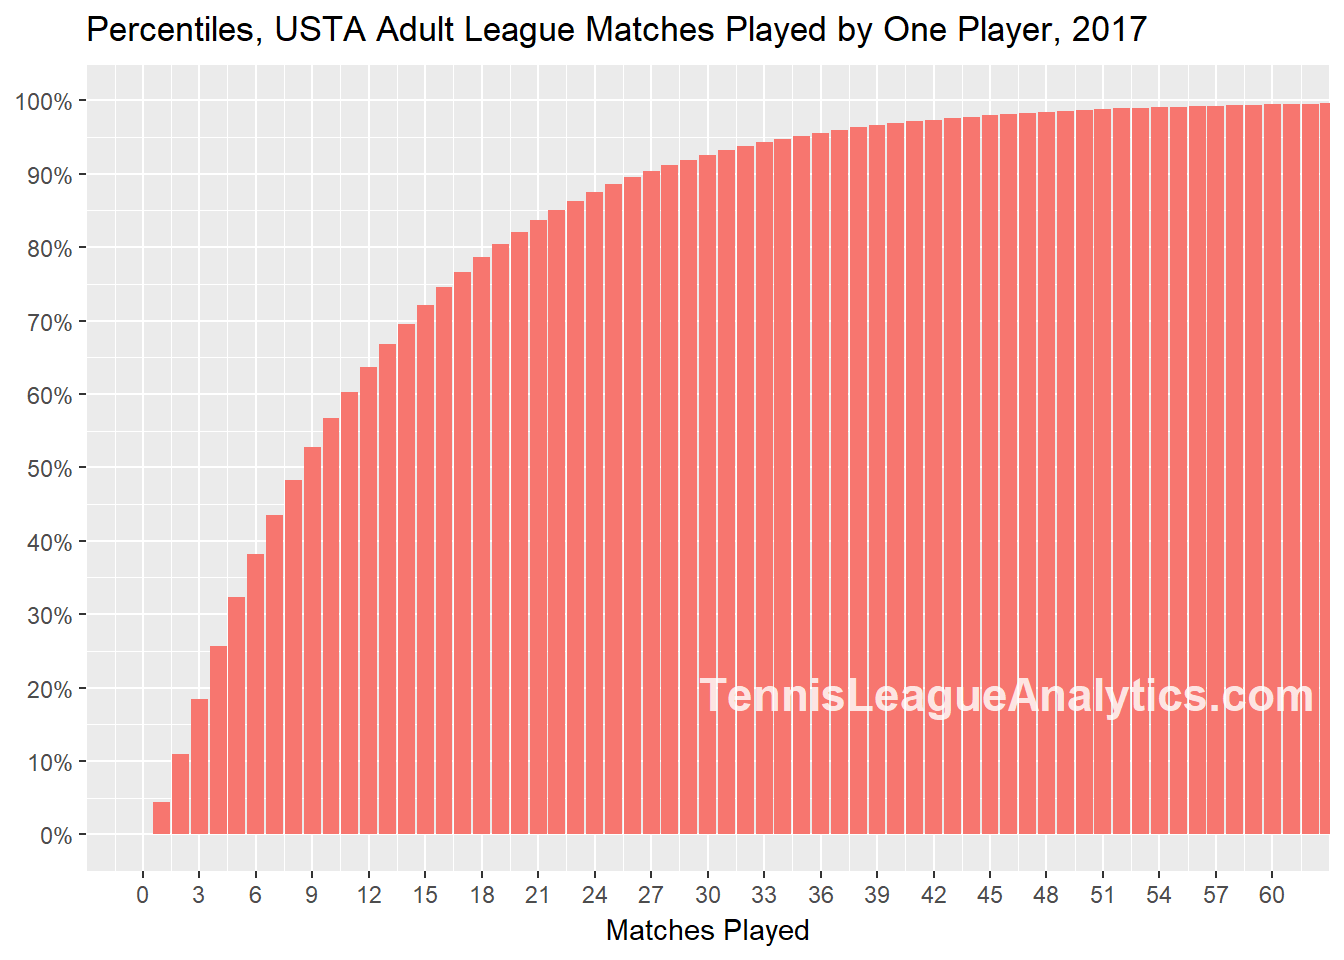
This might look complicated but it's really very simple.
To answer the question, "Where do I rank?", count or estimate the number of USTA league matches you played in 2017. Then look across the bottom for your number. Then follow the bar straight up to see what percentile you're in. The percentile is the number on the left side.
For example, if you played 9 matches, you are in the 53rd percentile, which means you played more matches then about half of all USTA League players. If you played 20 matches, you are in the 83rd percentile. To rank in the top 10%, you need to have played 27 matches.
And to be a One Percenter requires that you played 54 USTA tennis league matches. About 3,000 players did this. It would be nice if the USTA gave those players recognition. I don't know if they will, but Tennis League Analytics will give the first 10 One Percenters who contact us before February 21 a free Player Strength Rating Report.
By the way, the chart does not show the 700 players that played more than 70 matches. Just image that the Matches Played numbers at the bottom keep going to 223 and the bars are all pegged at 100%. If you want to see how many matches the top 30 players played, look at the previous post.
We'll keep it short today. We will continue these types of posts throughout February. Email your questions or contact us via Twitter or Facebook.
Follow us on Twitter, Facebook, or subscribe to our mailing list for updates.
Who plays the most USTA Matches?
Part 3 in USTA Adult Tennis League by the Numbers, 2017
Last week we were asked, "What's the most number of matches played by one player?" So in part 3 of USTA Adult Tennis League by the Numbers we'll answer this by section and nationally.
Previous posts in this series showed that about 300,000 adults played USTA league matches in 2017. The average number of league matches played: 12.4.
Let's see how the average number of matches differs by USTA Section.
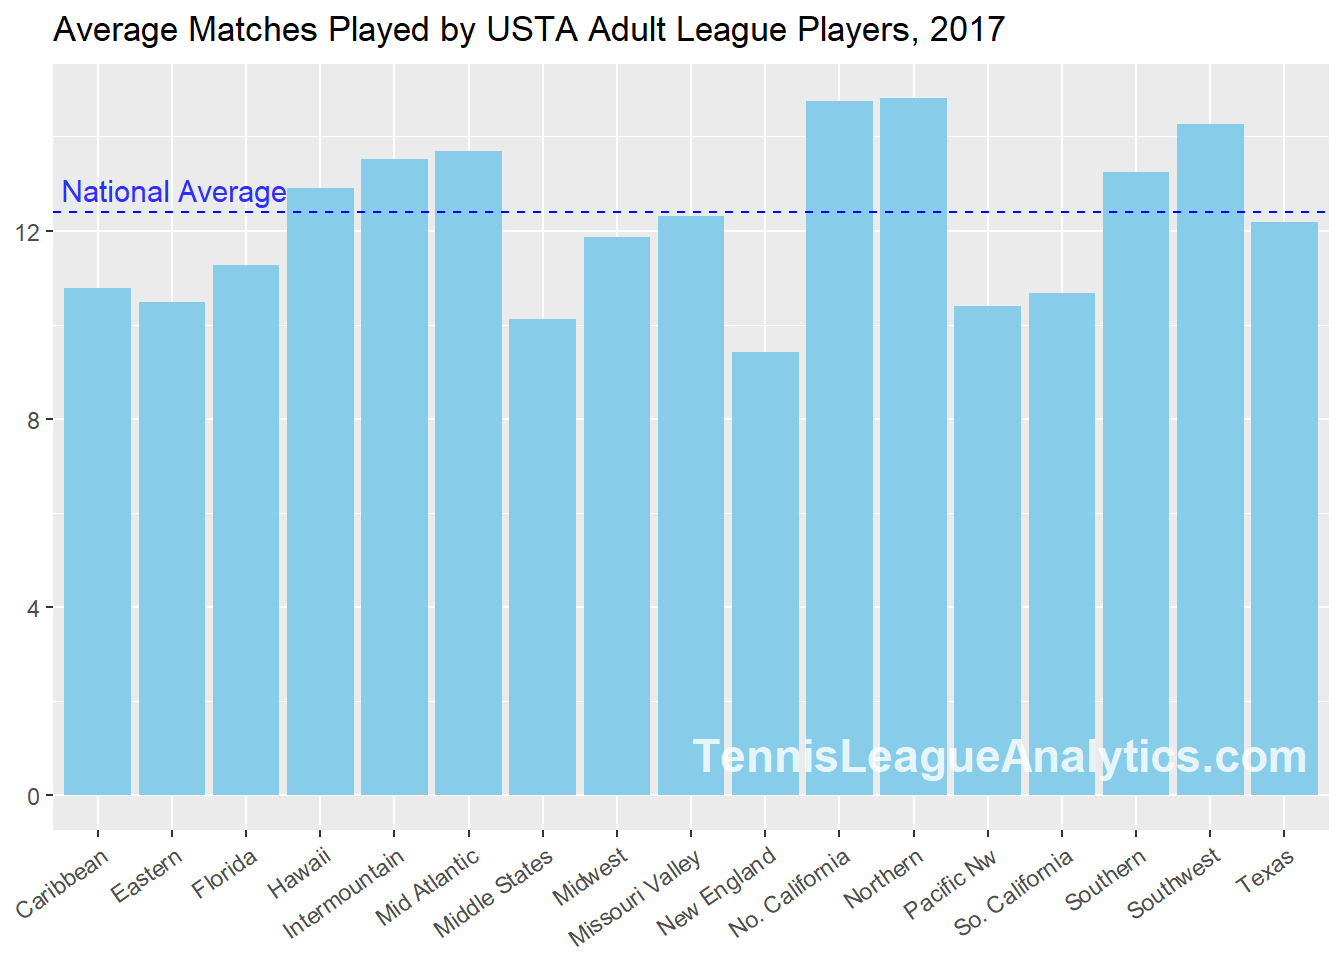
The Northern, No. California, and Southwest Sections lead the way with the highest average number of matches played by adult USTA player. At first glance, Northern at number 1 seems surprising. The weather is not conducive to year-round tennis. Northern is a small section. You can see this in a USTA section map from our June 18, 2017 post here.
Because Northern is small relative to the other sections, its average can be influenced by a few players that play a lot. The median may be a better indicator. The median is the number in the middle - half the players played fewer, and half played more. Let's see.
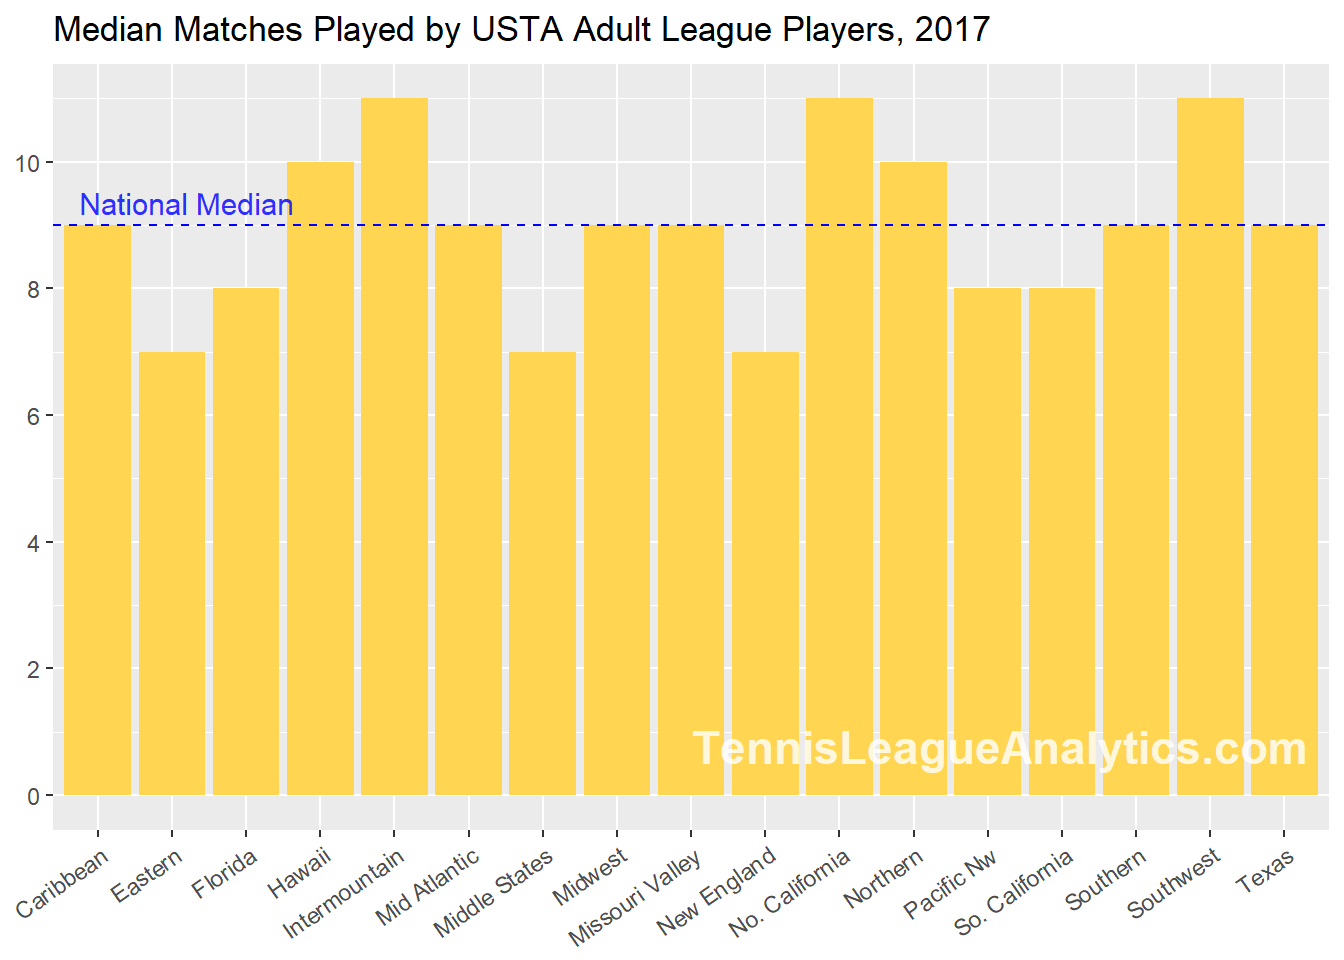
The median for Northern is smaller than its average, but the same is true for all the sections by 2 to 5 games. This means that the average is pulled up by some players that play a lot of matches. Let's see the largest number of matches played by one player in each section.
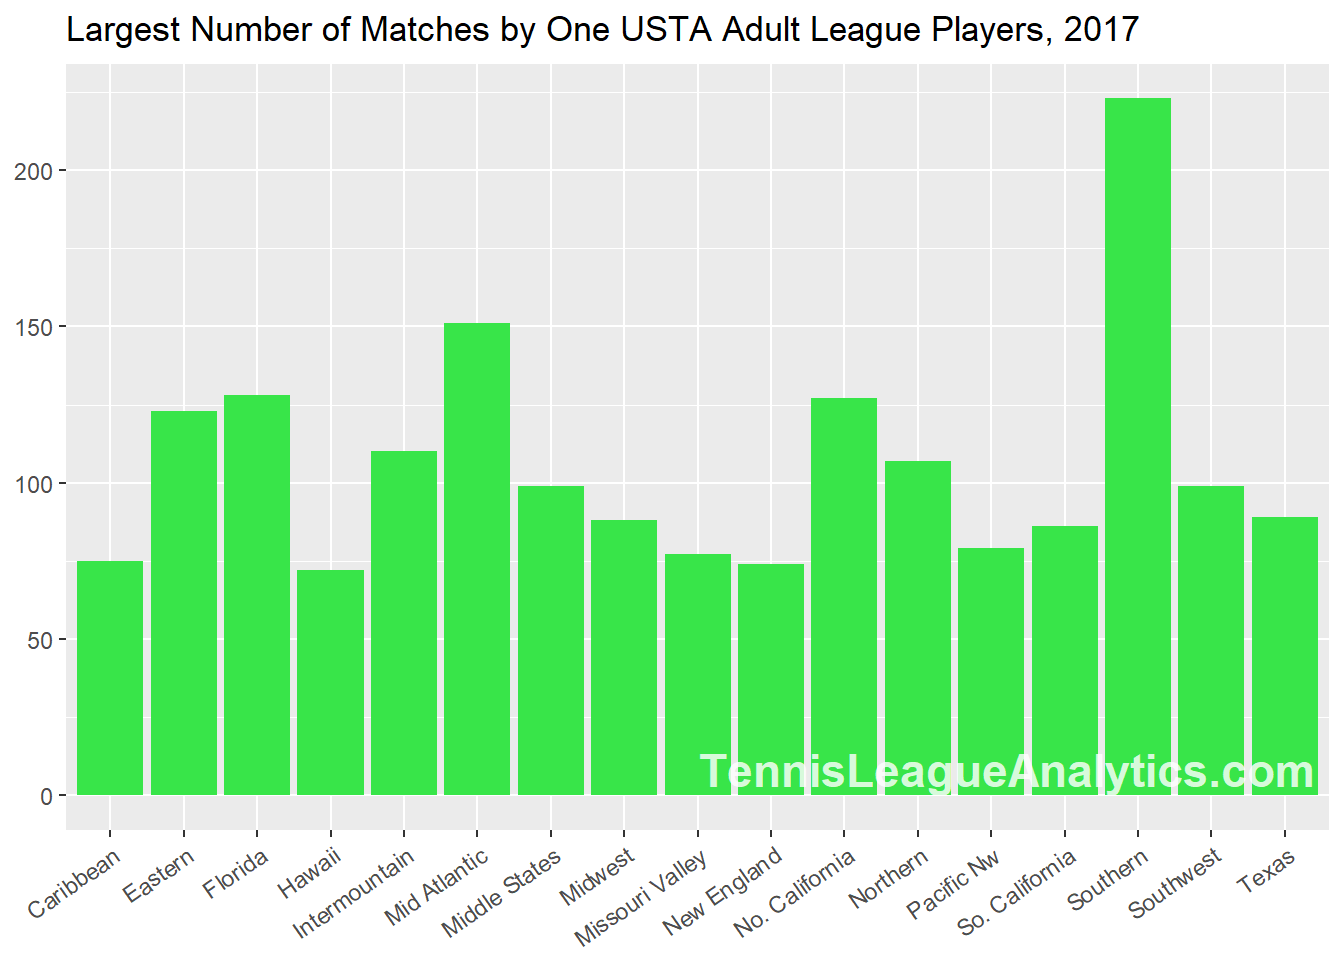
This is impressive. The most matches played by one player in each section ranges from approximately 75 to 225. Wow. Let's look at the top 30 number of matches played by one player.
| NTRP | Section | Matches Played |
|---|---|---|
| 4.0 | southern | 223 |
| 4.0 | southern | 193 |
| 3.0 | southern | 166 |
| 3.5 | southern | 158 |
| 3.5 | southern | 158 |
| 3.5 | southern | 158 |
| 3.0 | southern | 152 |
| 3.5 | mid atlantic | 151 |
| 3.5 | southern | 141 |
| 4.0 | mid atlantic | 140 |
| 4.0 | mid atlantic | 140 |
| 3.5 | southern | 134 |
| 3.5 | southern | 133 |
| 3.5 | southern | 130 |
| 4.0 | southern | 129 |
| 3.5 | florida | 128 |
| 4.0 | no. california | 127 |
| 4.0 | mid atlantic | 126 |
| 4.0 | southern | 125 |
| 3.5 | mid atlantic | 124 |
| 3.5 | eastern | 123 |
| 4.0 | southern | 121 |
| 3.5 | mid atlantic | 118 |
| 4.5 | mid atlantic | 117 |
| 3.5 | southern | 117 |
| 4.0 | southern | 115 |
| 3.0 | southern | 115 |
| 4.0 | southern | 114 |
| 3.5 | southern | 113 |
| 3.5 | southern | 112 |
Which turns out to be:
| Section | Count |
|---|---|
| Southern | 20 |
| Mid Atlantic | 7 |
| Eastern | 1 |
| Florida | 1 |
| No. California | 1 |
We'll continue these types of posts throughout February. Email your questions or contact us via Twitter or Facebook.
Follow us on Twitter, Facebook, or subscribe to our mailing list for updates.
USTA Adult Tennis League 2017 by the Numbers, Part 2
How many players are in each NTRP Level?
This is the second installment of our blog series on interesting USTA tennis league statistics from 2017.
Let's look at how many of the approximately 300,000 adult league players were in each NTRP level at the end of 2017.
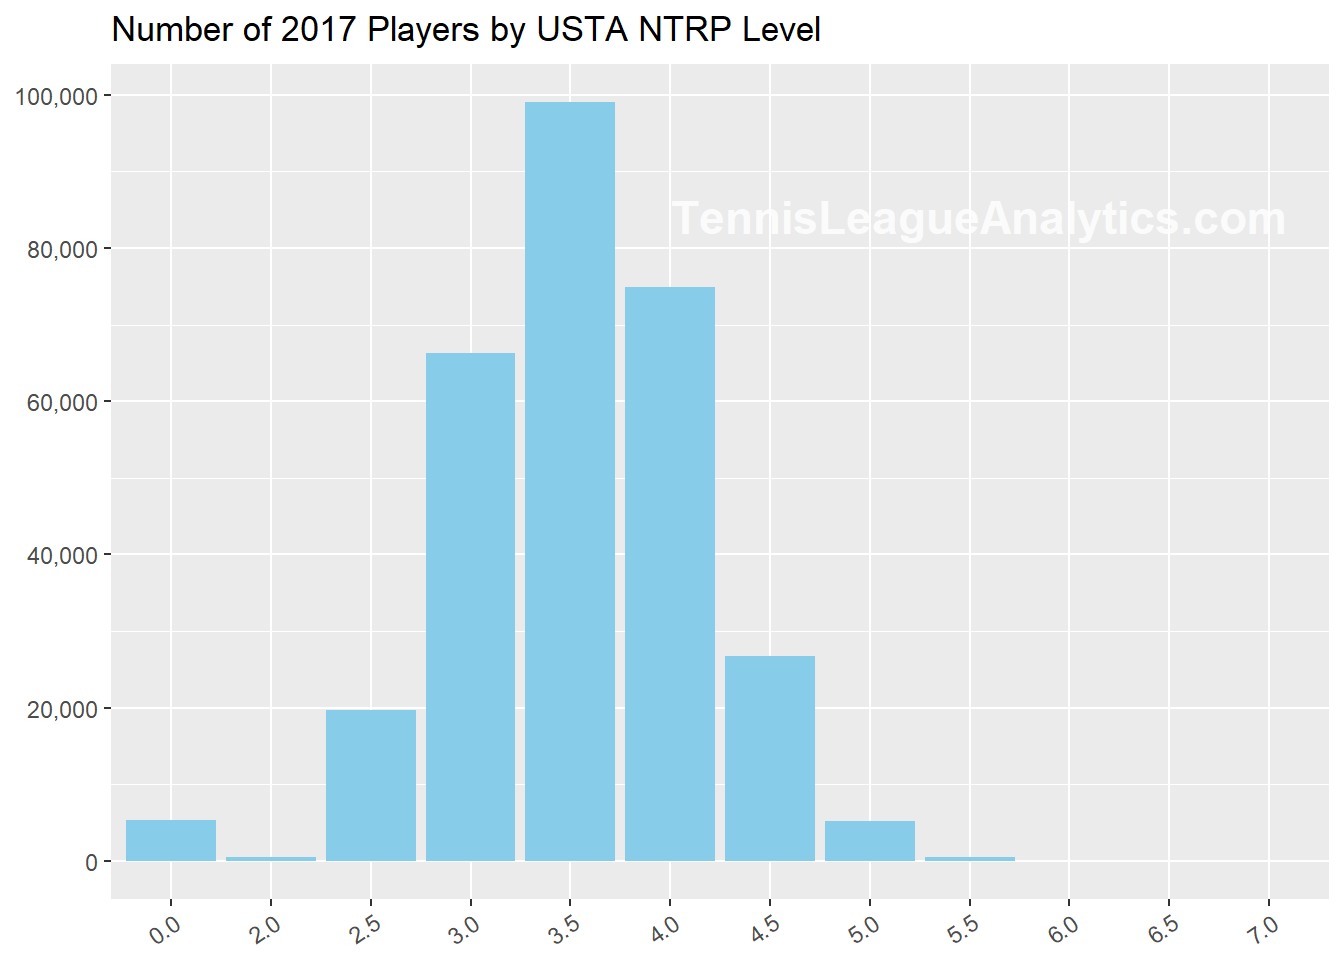
You might notice a few curious things in this chart. What's with the NTRP Rating of 0.0? We researched this and it appears that the USTA assigns a 0.0 NTRP rating to players who have not played enough matches to keep a Computer rating. Those players must self-rate for the new season. In this case, for the 2018 Season. The USTA has a FAQ page about these types of things here though the 0.0 Level is not explicitly mentioned.
There are no league players at 1.0 or 1.5. And while 6.0, 6.5, and 7.0 appear empty, there are, respectively, twelve, six, and nine players at those levels.
In terms of percentages, here's an easy way to look at the numbers:
Percent of USTA Adult League Players by NTRP, Year-End 2017
Ignoring the NTRP 0.0 Level
| NTRP Group | Percentage |
|---|---|
| 3.0 and below | 31% |
| 3.5 | 34% |
| 4.0 and above | 37% |
Roughly, one-third below NTRP 3.5, one-third at 3.5, and one-third above 3.5.
A 4.0 player is in the top 37% of players. A 4.5, top 11%. And a 5.0, top 2%.
We'll continue these types of posts throughout February. Email your questions or contact us via Twitter or Facebook.
Follow us on Twitter, Facebook, or subscribe to our mailing list for updates.
USTA Tennis League 2017 in Review, Part 1
2017 By the Numbers
In 2018 Tennis League Analytics will again cover USTA Adult League Championship events and blog about the strongest teams by flights. Until then we'll look at interesting 2017 USTA League numbers.
Almost 300,000 tennis players participated in USTA league matches in 2017, which is about 12,000 more than in the previous year. The chart below compares 2016 to 2017 by Section. USTA Southern really stands out not just because of their sheer size but also because of their growth. WOW!
And would you have guessed that the next largest USTA section by players is the Midwest?
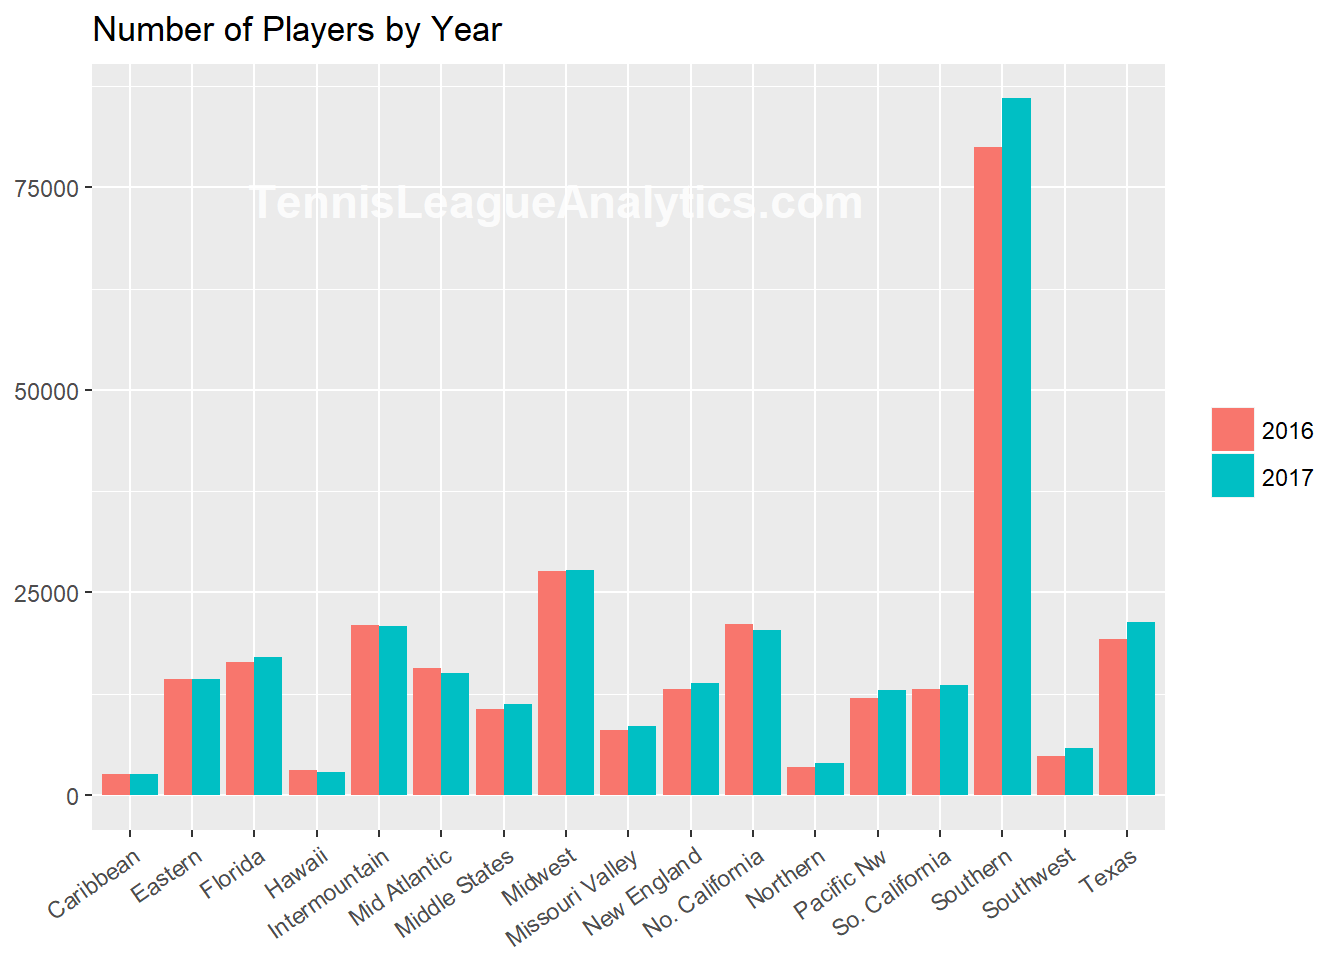
To see what these numbers look like on a USTA section map, check out the three maps that Tennis League Analytics posted last July - they appear on our blog archive here. The USTA section maps show counts that combine 2014 to 2017, but the proportions are similar to 2017's numbers.
These 300,000 USTA Tennis League Players competed in about 1.25 million USTA League matches. The next chart shows the split of singles versus doubles. About three doubles were played for every singles match.
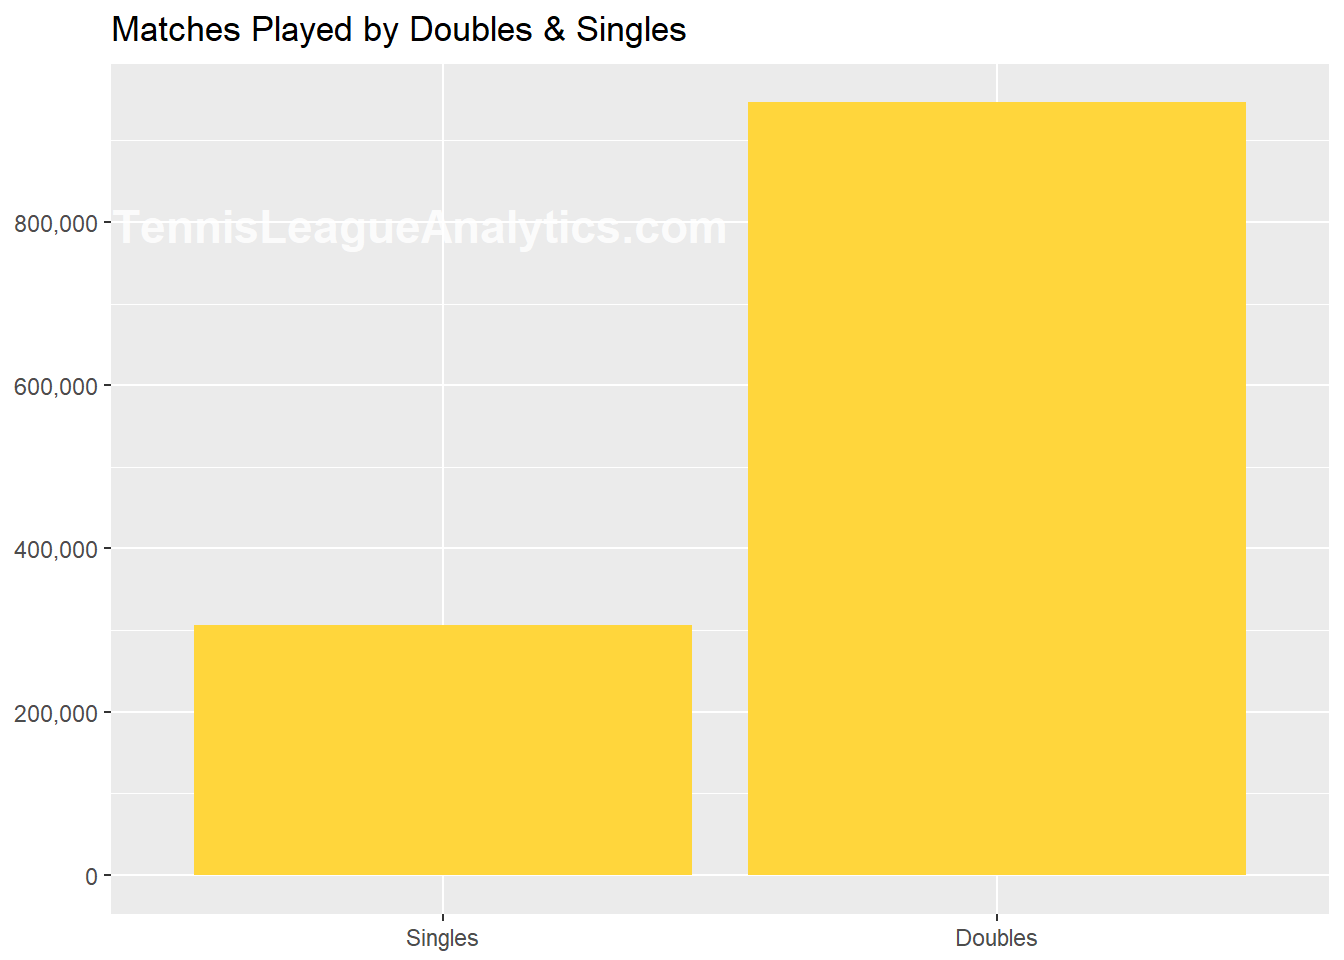
The average number of matches played by a 2017 USTA Adult League player: 12.4. How many did you play?
We'll continue to look at more stats next time. Do you have interesting question?
How about the top-ten list of most matches played by a player? Statistics by gender? How many players were bumped-up? Were any players bumped up by more than one NTRP rating level? Which USTA Section has the highest average rating?
Send us a tweet or post on our Facebook page.
Follow us on Twitter, Facebook, or subscribe to our mailing list for updates.
Get ready for 2018 USTA Tennis Leagues
All 2017 and 2018 Early Start Matches updated!

All Tennis League Analytics reports have been updated with all 2017 Season and 2018 Season (early start) matches played through 12/31/2017.
Captains have been ordering Flight Scouting, Team Player Trend, and Appealed and Self-Rated Player Reports to get a jump on their opponents.
We are offering club pro's and tournament directors one free tournament seeding service. We are limiting this to one per USTA District or Area on a first-come basis and for a limited-time. See our previous post for more details.
While we wait for 2018 Championship events to start, we'll blog about interesting USTA Tennis League Statistics. If you have an interesting question about USTA Tennis Leagues, email us. We might use your question in a blog.
Follow us on Twitter, Facebook, or subscribe to our mailing list for updates.
Blog Archive
Looking for a blog post showing the top teams at a previous USTA Sectional Championship?
Or perhaps some of our in depth analysis on what types of teams win USTA matches?
Click Here for our Blog Archive