Caribbean USTA Section dominates California, Middle States, Northern, Florida and Texas.
Self rated players?

Last time we saw that the likelihood of three USTA National Championships by a section with a little under 3000 USTA players is extremely small - more on that estimate below - you can see the details in the previous post.
One possibility of such an extraordinary result is that the team was comprised of self-rated players that sand-bagged. Checking the rating type of each player showed that each player possessed a computer rating - type C - in early 2017. So sandbagging did not happen.
The two other potential causes are better captains or a rating system that is not calibrated with the other sections. At this point I don't have the data to look into these ideas. But we'll look forward to running the numbers again at the end of 2018.
We received two questions about the likelihood estimates from the last post. Yes, we did look at the Gamma Distribution, which estimated once in 69,000 years. But I chose to use the very wide range of 13 to 100,000 years, as described, given the small amount of data.
We'll again start to cover Sectional Championships from around the country.
If you like this type of info, let your tennis friends know about TLA - it really helps spread the word. Email your questions or contact us via Twitter or Facebook.
Follow us on Twitter, Facebook, or subscribe to our mailing list for updates.
Caribbean USTA Section way ahead in National Championships
Statistical anomaly or something else?
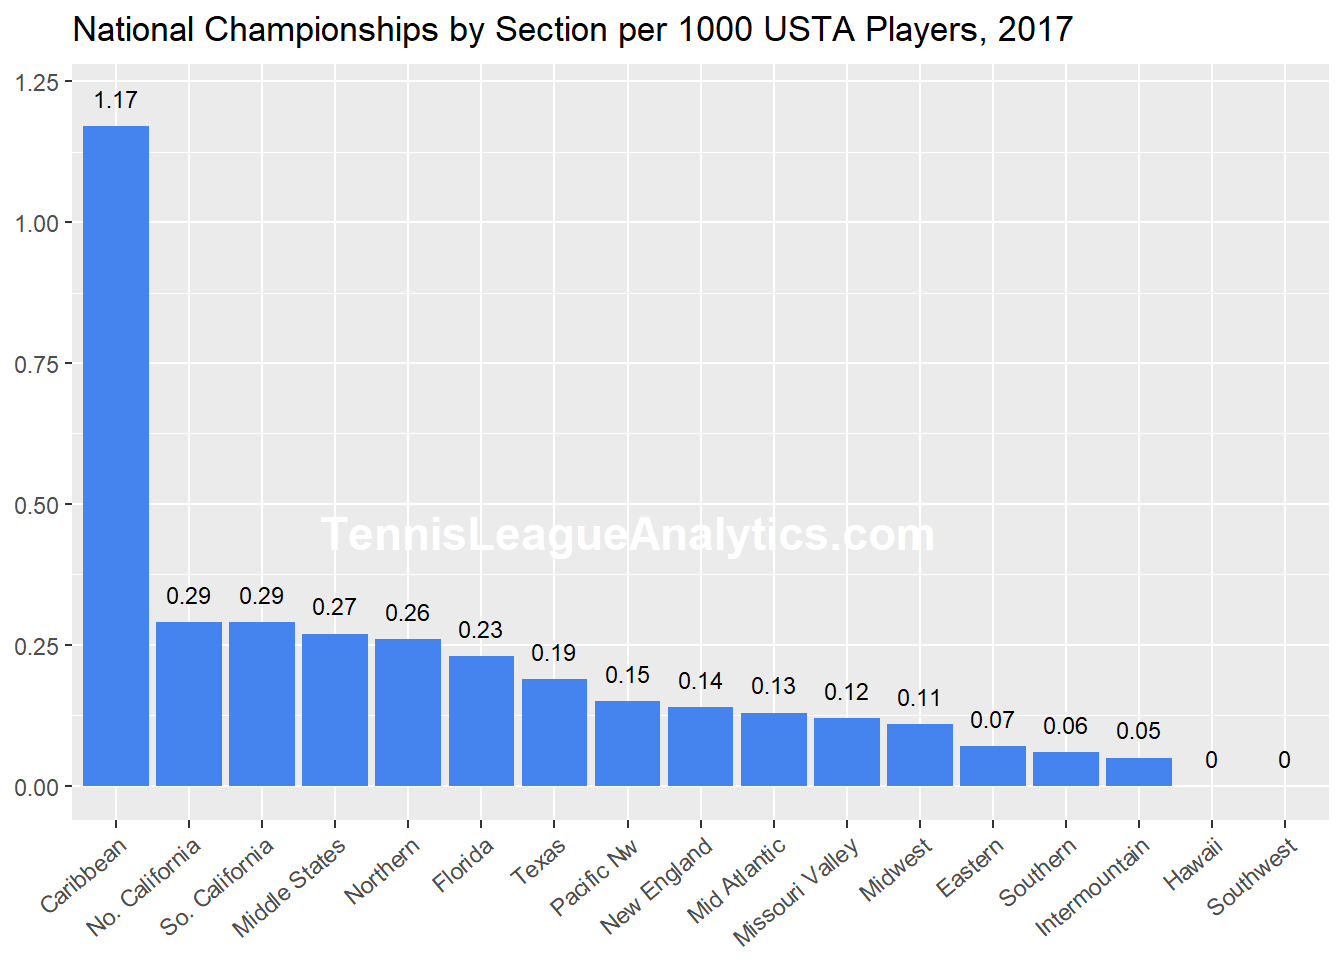
The previous blog post showed the number of National Championships (NCs) won by each USTA Section. The Caribbean section significantly outperformed all other sections. Here's a graph that highlights Caribbean's extraordinary performance.
This part gets a little techy, but try to read through it. For the less intrepid, look at the next chart and then the TL;DR at the end.
Winning 1.17 NCs per 1k players (which is another way of saying, 'Winning 3 National Championships with less than 3,000 players) seems very disproportional when compared to the other USTA sections. So the natural question is, "How often should this happen?"
Having 5 to 10 years of data would be useful, but it's not available. So we'll do the best we can with only 2017's data (I know that USTA employees read this blog so if you can make more years available, I'd be glad to crunch the numbers and cite your contribution).
If we believe that players and captains are similar in each region, we can make a reasonable guess about the probability that a section with less than 3,000 players can win 3 national championships in one year. Here's how.
If we believe that player ratings are consistent from section to section (e.g., a strong 3.5 in No Cal is a strong 3.5 in Eastern), and that captains form teams similarly in each section (e.g., some captains stick with the members of their club, other captains try to stack teams with the strongest players in their geographic region), then the number of NCs a section should win is .14 per 1k players. That's just the expected value of NCs for the number of NCs awarded in 2017 and the number of players in 2017.
Of course the number of NCs won by each USTA section will vary from year to year. That number should vary, per our assumption, within a normal distribution - what's often called a bell curve - with an average of .14. Now, this is not purely correct because the number of NCs per 1k players is always zero or larger. But to keep things simple, we will use a normal distribution and make some adjustments to estimate an answer.
A standard deviation can be estimated from the 2017 data (Caribbean will be treated as a statistical outlier) and then a range of standard deviations can be tested to estimate how frequently 1.17 NCs should be won. Phew. Let's do it.
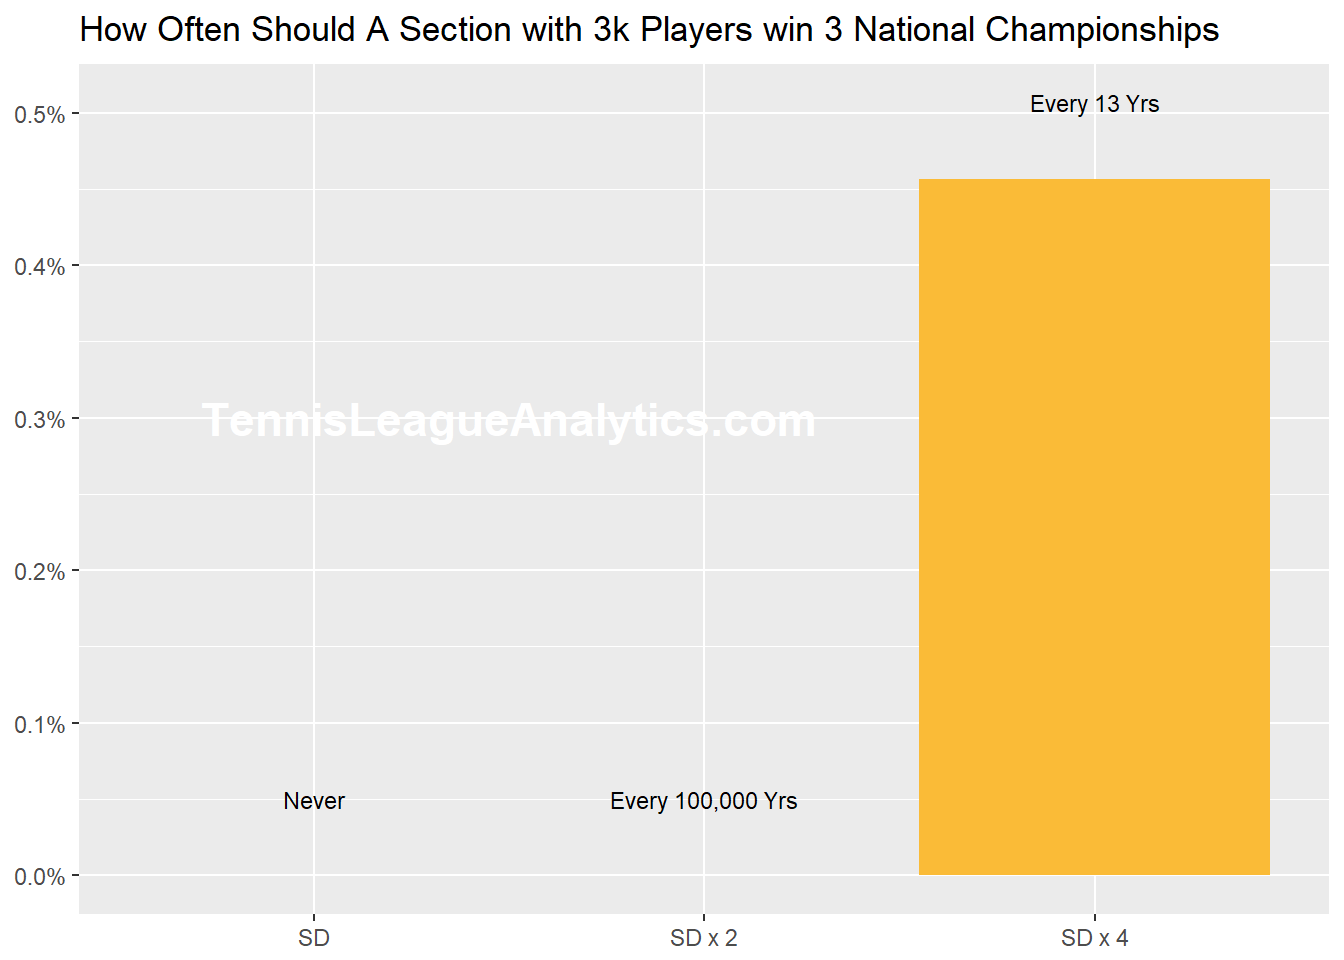
Using the sample standard deviation (SD) of 0.099, 1.17 NCs per 1k players should practically never happen. The exact number is .00000000000000000000000009 (25 zeros). But again, this is not correct for the reason mentioned above.
And don't email me about not using scientific notation. This is not a white paper.
Let's try a SD of double the sample estimate. A bigger SD means the NCs per 1k players has a wider distribution. Making the SD bigger is like giving extreme outcomes the benefit of the doubt of not being so extreme. Now the chance to reach 1.17 NCs per 1k players is 0.00000009 (7 zeros). Less than 1 in 100,000 years. But what if we double again?
Using 4 times the sample SD estimate gives the chance of 1.17 NCs per 1k players as .005 - once every 13 years. All of these estimates are based on 17 USTA Sections.
So using just one year of data and increasing the variability of results by 4, winning 3 NCs with 3,000 players should not happen often.
So what would cause this anomaly? Some possibilities:
1. Better captains - they know how to stack a team.
2. The rating system within the section is not calibrated with the other sections
3. Sandbagging - there's a post on this a few posts back
4. A combination of the above.
I'll try to dig for some more clues. Your thoughts?
TL;DR
Using only 2017's data on National Championships (NCs), winning 3 NCs with 3,000 players should happen, by chance, somewhere between every 13 years to 100,000 years.
We'll look for clues about what could have led to this type of performance next time.
If you like this type of info, let your tennis friends know about TLA - it really helps spread the word. Email your questions or contact us via Twitter or Facebook.
Follow us on Twitter, Facebook, or subscribe to our mailing list for updates.