Caribbean USTA Section way ahead in National Championships
Statistical anomaly or something else?
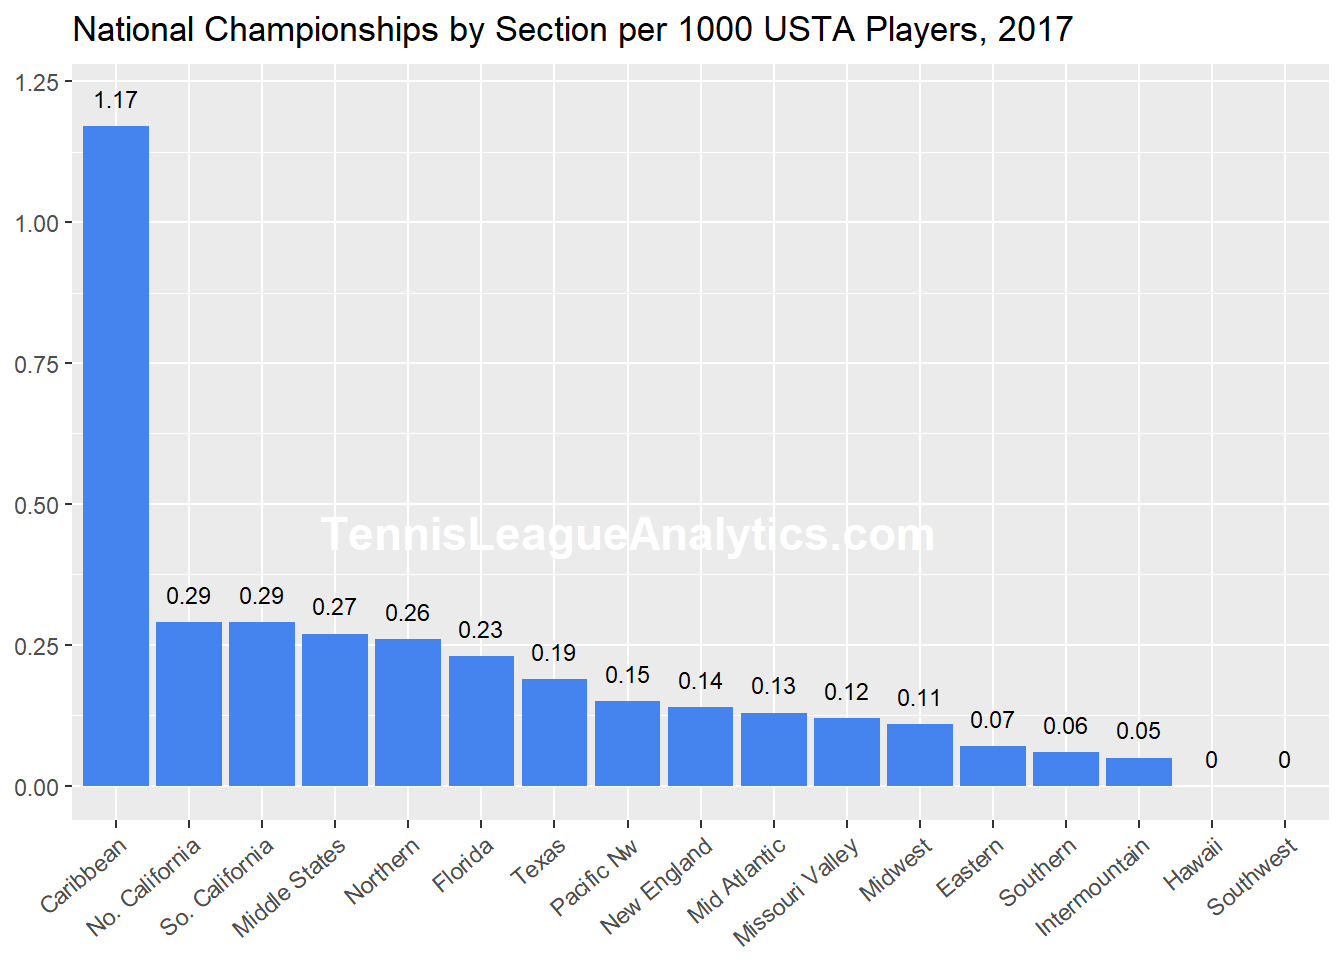
The previous blog post showed the number of National Championships (NCs) won by each USTA Section. The Caribbean section significantly outperformed all other sections. Here's a graph that highlights Caribbean's extraordinary performance.
This part gets a little techy, but try to read through it. For the less intrepid, look at the next chart and then the TL;DR at the end.
Winning 1.17 NCs per 1k players (which is another way of saying, 'Winning 3 National Championships with less than 3,000 players) seems very disproportional when compared to the other USTA sections. So the natural question is, "How often should this happen?"
Having 5 to 10 years of data would be useful, but it's not available. So we'll do the best we can with only 2017's data (I know that USTA employees read this blog so if you can make more years available, I'd be glad to crunch the numbers and cite your contribution).
If we believe that players and captains are similar in each region, we can make a reasonable guess about the probability that a section with less than 3,000 players can win 3 national championships in one year. Here's how.
If we believe that player ratings are consistent from section to section (e.g., a strong 3.5 in No Cal is a strong 3.5 in Eastern), and that captains form teams similarly in each section (e.g., some captains stick with the members of their club, other captains try to stack teams with the strongest players in their geographic region), then the number of NCs a section should win is .14 per 1k players. That's just the expected value of NCs for the number of NCs awarded in 2017 and the number of players in 2017.
Of course the number of NCs won by each USTA section will vary from year to year. That number should vary, per our assumption, within a normal distribution - what's often called a bell curve - with an average of .14. Now, this is not purely correct because the number of NCs per 1k players is always zero or larger. But to keep things simple, we will use a normal distribution and make some adjustments to estimate an answer.
A standard deviation can be estimated from the 2017 data (Caribbean will be treated as a statistical outlier) and then a range of standard deviations can be tested to estimate how frequently 1.17 NCs should be won. Phew. Let's do it.
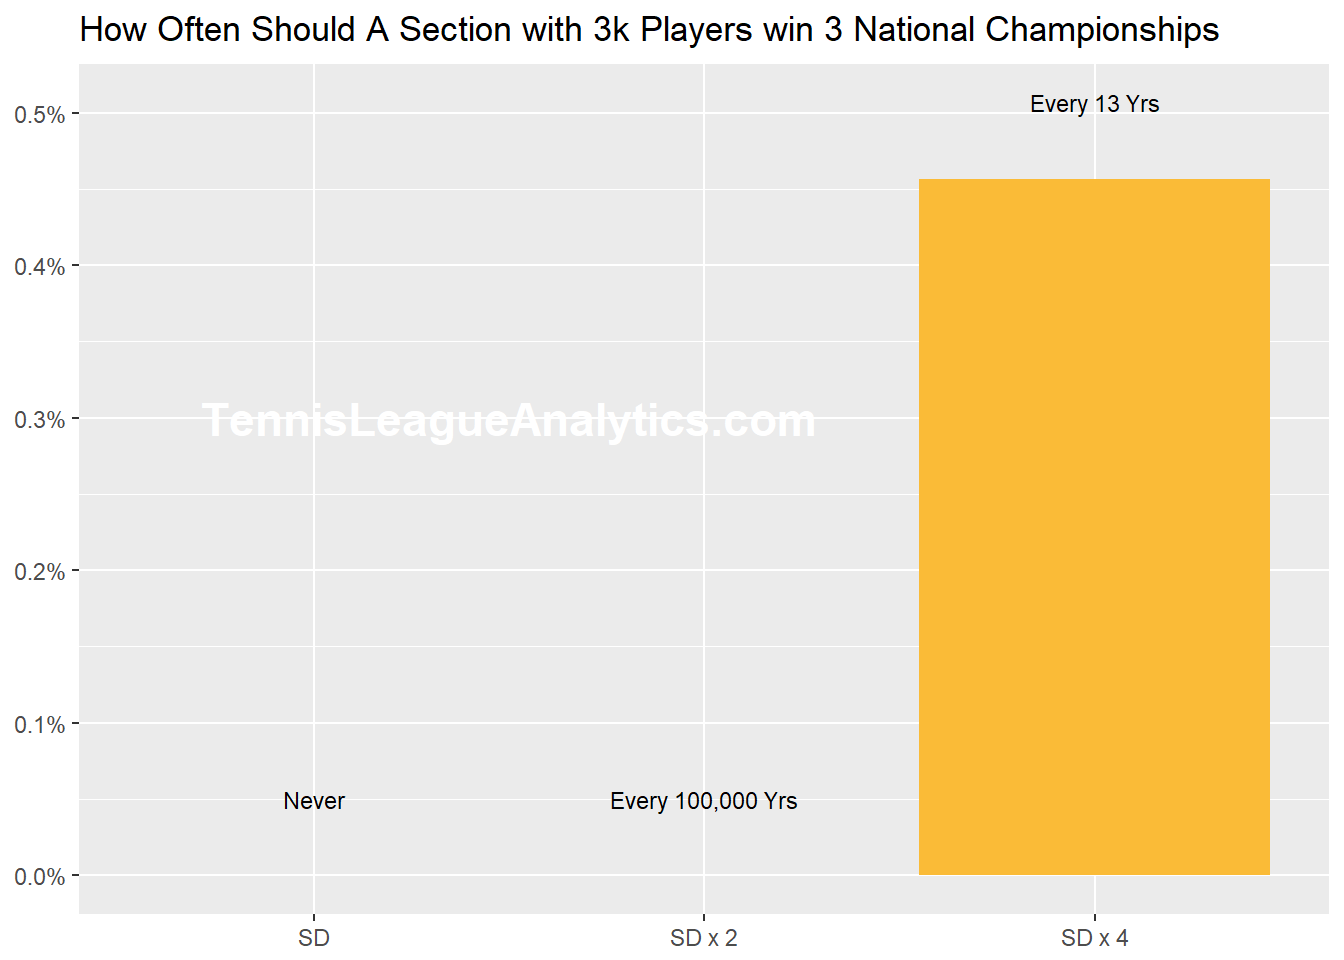
Using the sample standard deviation (SD) of 0.099, 1.17 NCs per 1k players should practically never happen. The exact number is .00000000000000000000000009 (25 zeros). But again, this is not correct for the reason mentioned above.
And don't email me about not using scientific notation. This is not a white paper.
Let's try a SD of double the sample estimate. A bigger SD means the NCs per 1k players has a wider distribution. Making the SD bigger is like giving extreme outcomes the benefit of the doubt of not being so extreme. Now the chance to reach 1.17 NCs per 1k players is 0.00000009 (7 zeros). Less than 1 in 100,000 years. But what if we double again?
Using 4 times the sample SD estimate gives the chance of 1.17 NCs per 1k players as .005 - once every 13 years. All of these estimates are based on 17 USTA Sections.
So using just one year of data and increasing the variability of results by 4, winning 3 NCs with 3,000 players should not happen often.
So what would cause this anomaly? Some possibilities:
1. Better captains - they know how to stack a team.
2. The rating system within the section is not calibrated with the other sections
3. Sandbagging - there's a post on this a few posts back
4. A combination of the above.
I'll try to dig for some more clues. Your thoughts?
TL;DR
Using only 2017's data on National Championships (NCs), winning 3 NCs with 3,000 players should happen, by chance, somewhere between every 13 years to 100,000 years.
We'll look for clues about what could have led to this type of performance next time.
If you like this type of info, let your tennis friends know about TLA - it really helps spread the word. Email your questions or contact us via Twitter or Facebook.
Follow us on Twitter, Facebook, or subscribe to our mailing list for updates.
Which USTA Section wins the most National Championships.
How many should each section win?
This blog series will look at which USTA Sections won the most National championships (NCs) last year and try to find interesting insights about the winning teams.
Let's start by looking at the number of NCs won by each section.
| Section | Championships |
|---|---|
| No. California | 6 |
| Southern | 5 |
| Florida | 4 |
| So. California | 4 |
| Texas | 4 |
| Caribbean | 3 |
| Middle States | 3 |
| Midwest | 3 |
| Mid Atlantic | 2 |
| New England | 2 |
| Pacific Nw | 2 |
| Eastern | 1 |
| Intermountain | 1 |
| Missouri Valley | 1 |
| Northern | 1 |
The table shows that Northern California won the most National Championships with six, followed by Southern with five, and Florida, Southern California, and Texas with four.
15 of the 17 USTA sections won at least one National Championship with only Hawaii and Southwest with none. If we look at the blog from June 18, 2017, which appears here, we see that Hawaii and Southwest are two of the smaller sections.
Let's update the section sizes from the map to show only 2017 and rerank the number of National Championships after considering the size of each section.
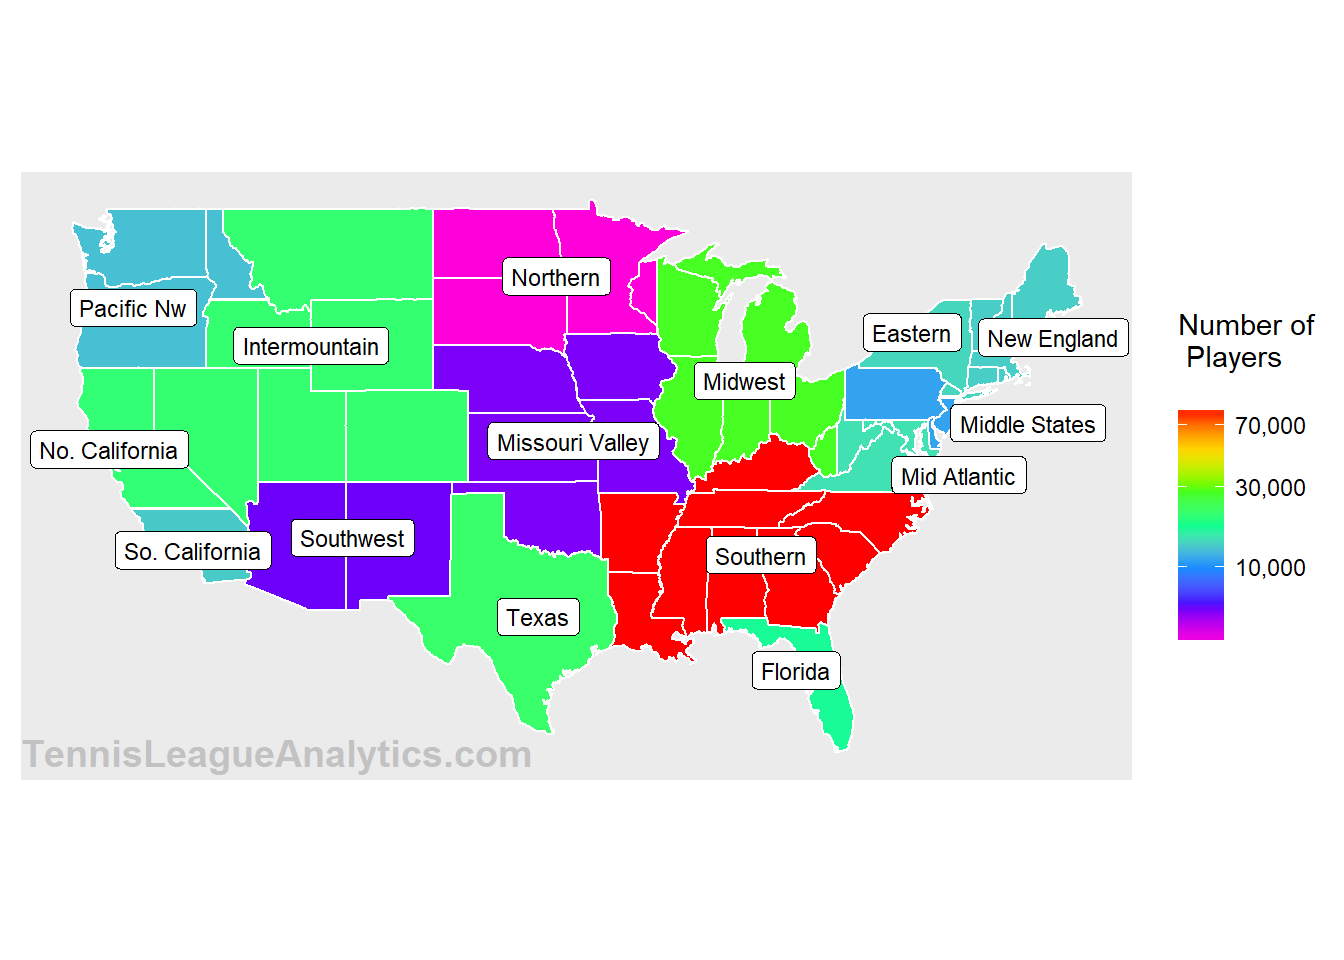
The map shows the number of 2017 players by USTA Section, not including Hawaii and the Caribbean, both of which have fewer than 3,000 players (both would be shaded violet). Southern is the largest with over 80,000 players.
The next table shows the number of 2017 USTA Adult League National Championships won per player.| Section | National Championships |
|---|---|
| Caribbean | 1.17 |
| No. California | 0.29 |
| So. California | 0.29 |
| Middle States | 0.27 |
| Northern | 0.27 |
| Florida | 0.23 |
| Texas | 0.19 |
| Missouri Valley | 0.18 |
| Pacific Nw | 0.15 |
| New England | 0.14 |
| Mid Atlantic | 0.13 |
| Midwest | 0.11 |
| Eastern | 0.07 |
| Southern | 0.06 |
| Intermountain | 0.05 |
| Hawaii | 0.00 |
| Southwest | 0.00 |
Holy Smokes! The Caribbean Section, which has the smallest player population (about 2600), won 1.17 National Championships per 1000 players. To put that into perspective while trying to avoid stats jargon, with 42 NCs and about 290,000 players in 2017, one NC is expected for every 7,000 players.
On this basis, the Caribbean Section should win one NC about every three years. But they won three in 2017. And that's more than 4 times the rate of the next closest section. The chance of this randomly happening is extremely small.
We'll look into these numbers more in the next post.
Sandbagging? Self rated players bumped up twice as often!
USTA Tennis League by the Numbers, 2017, Part 7
Our previous post showed that 30% of players bumped up in 2017 were Self Rated. This percentage seems to indicate that self-rated players are not bumped up more often than other players.
But to get the the whole story, the number of Self and Computer Rated players needs to be considered. Let's see what the story looks like when we do this.
This calculation is a little tricky because a Self Rated player's USTA Rating Type can change during the year. For example, a player can receive three 'strikes'. You can learn about USTA strikes here. But we have a data sample with enough size to make a reasonable estimate. The next chart shows the number of players we'll use for the estimate.
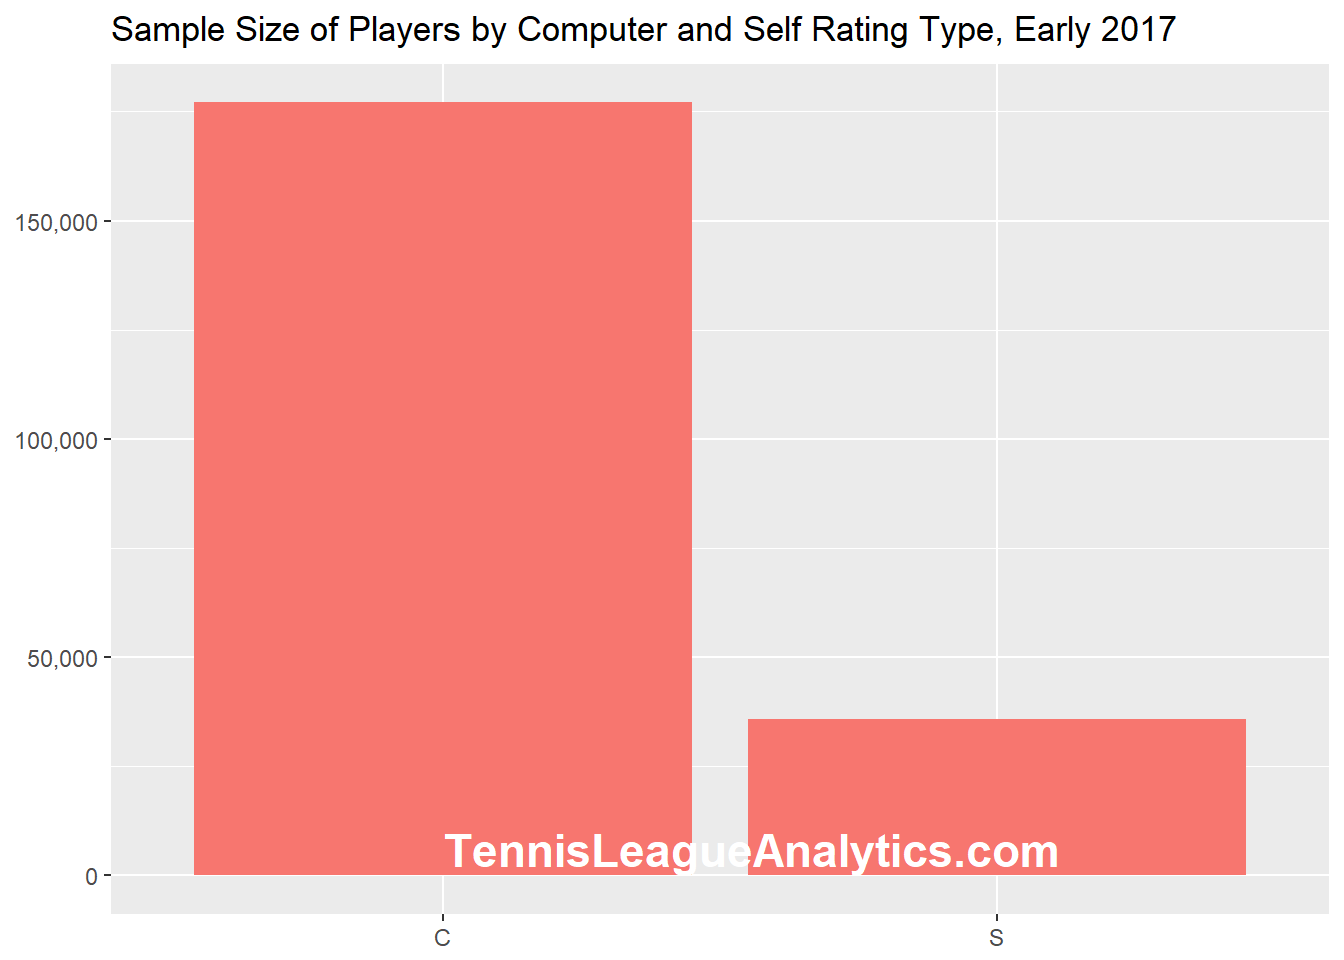
So for 2017 we'll look at 170k Computer Rated (C) and 36k Self Rated (S) USTA adult league players. Let's see if the percentage of players bumped up differs between the two groups.
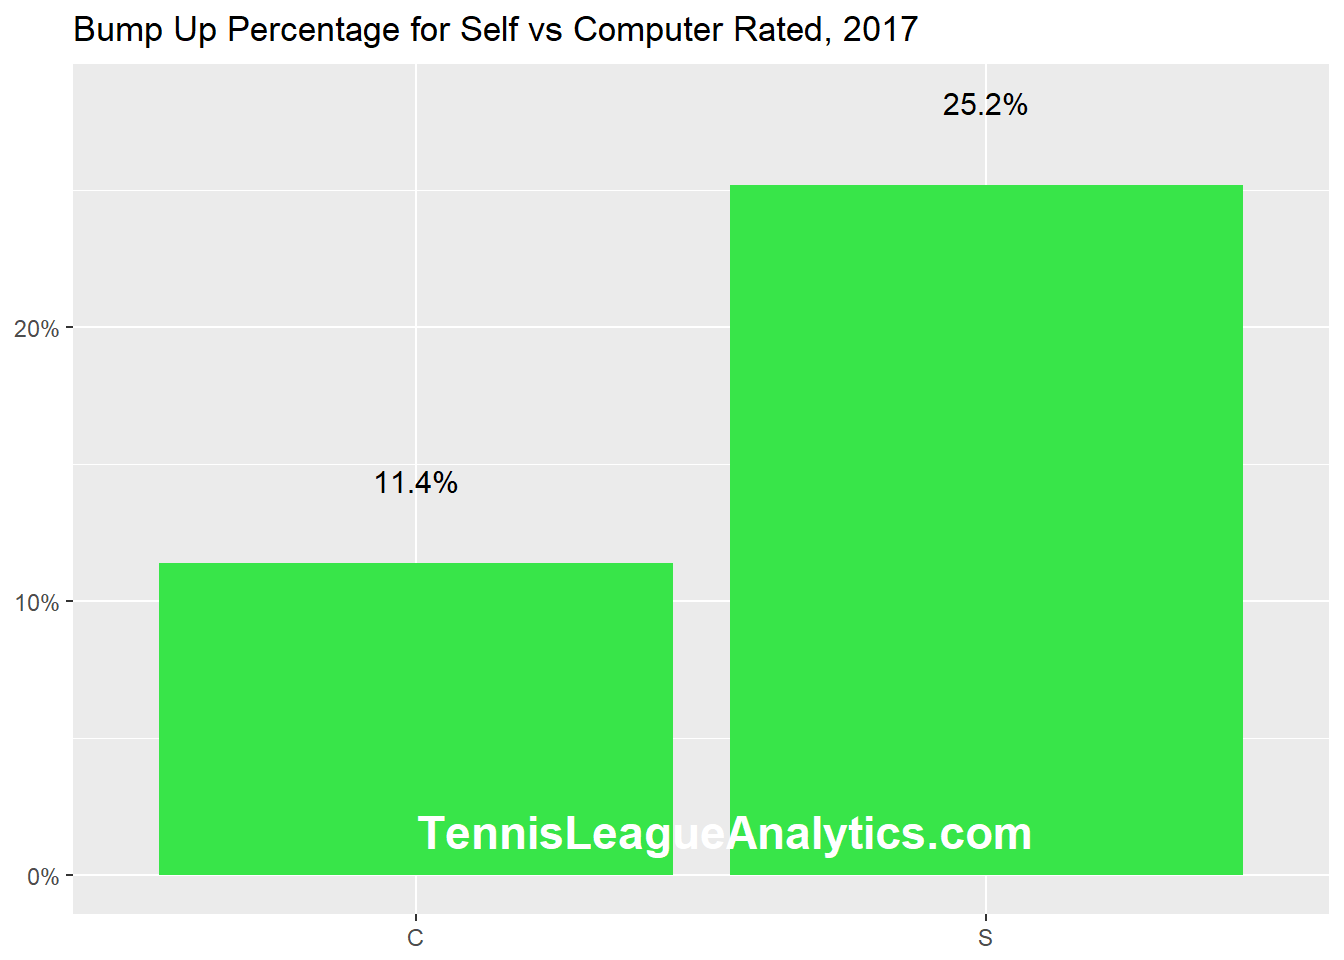
This seems to support what so many USTA league players observe - that self rated players tend to under rate, i.e., sand bag.
What do you think? I'd be happy to read your thoughts on this.
If you like this type of info, let your tennis friends know about TLA - it really helps spread the word. Email your questions or contact us via Twitter or Facebook.
Follow us on Twitter, Facebook, or subscribe to our mailing list for updates.
Are self rated players bumped up more than others?
Part 6, USTA Adult Tennis League by the Numbers, 2017
The previous post showed that about 15% of all USTA tennis league players were either bumped up or down. Let's see what percentage of those players were self rated.
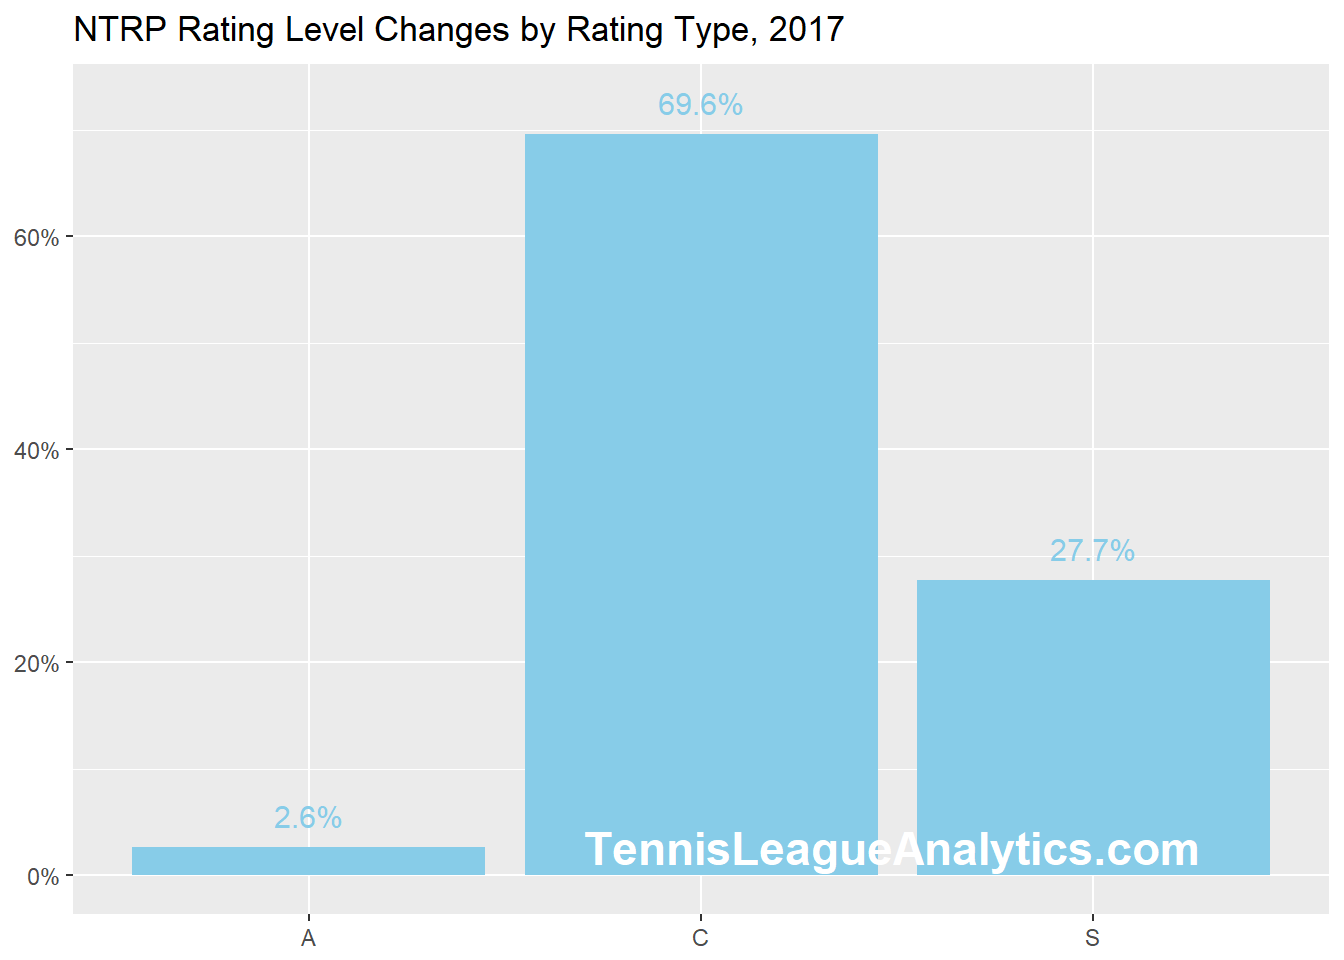
The graph shows the percentage of players with an NTRP level change by three rating types:
- A: Appeal
- C: Computer
- S: Self-rated
There are three additional rating types with numbers small enough to ignore. You can see the full list of rating types at this helpful USTA FAQs page.
Of the 44,000 players bumped up or down, 28% (about 12,000) were self rated. Does this percentage change when we look only at bumped up players?
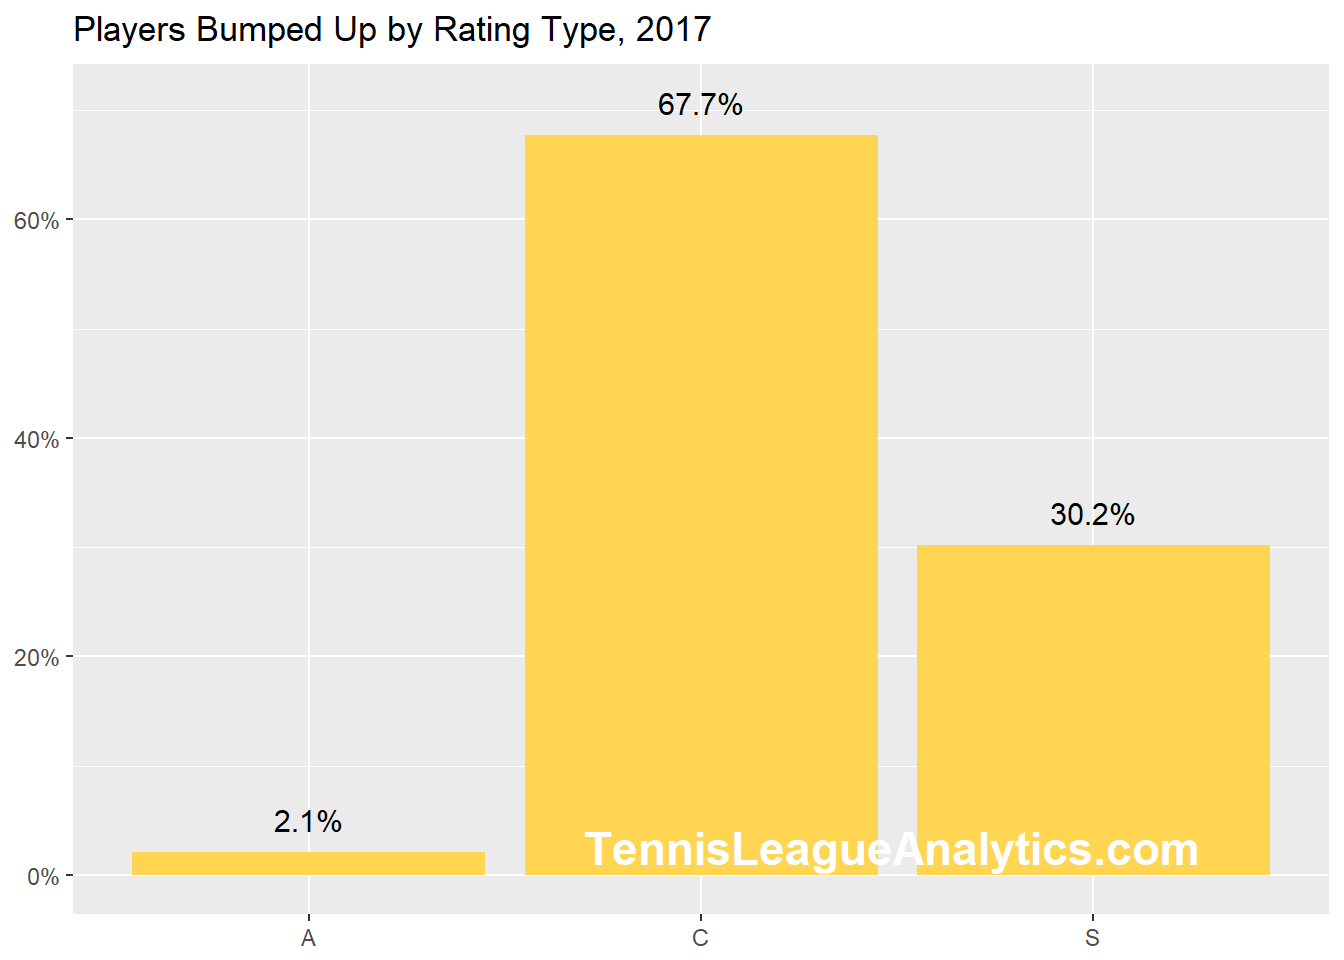
So far, it does not look like self rated players are bumped up more than others. But there's an additional important point to consider - How many players are Computer vs Self rated? We'll look at this in the next post.
If you like this type of info, let your tennis friends know about TLA. Email your questions or contact us via Twitter or Facebook.
Follow us on Twitter, Facebook, or subscribe to our mailing list for updates.
How many players were bumped up in 2017?
Part 5, USTA Adult Tennis League Stats, 2017
Every USTA tennis league season players seem to anticipate year end NTRP ratings level changes. Let's see how many players were bumped up or bumped down in 2017.
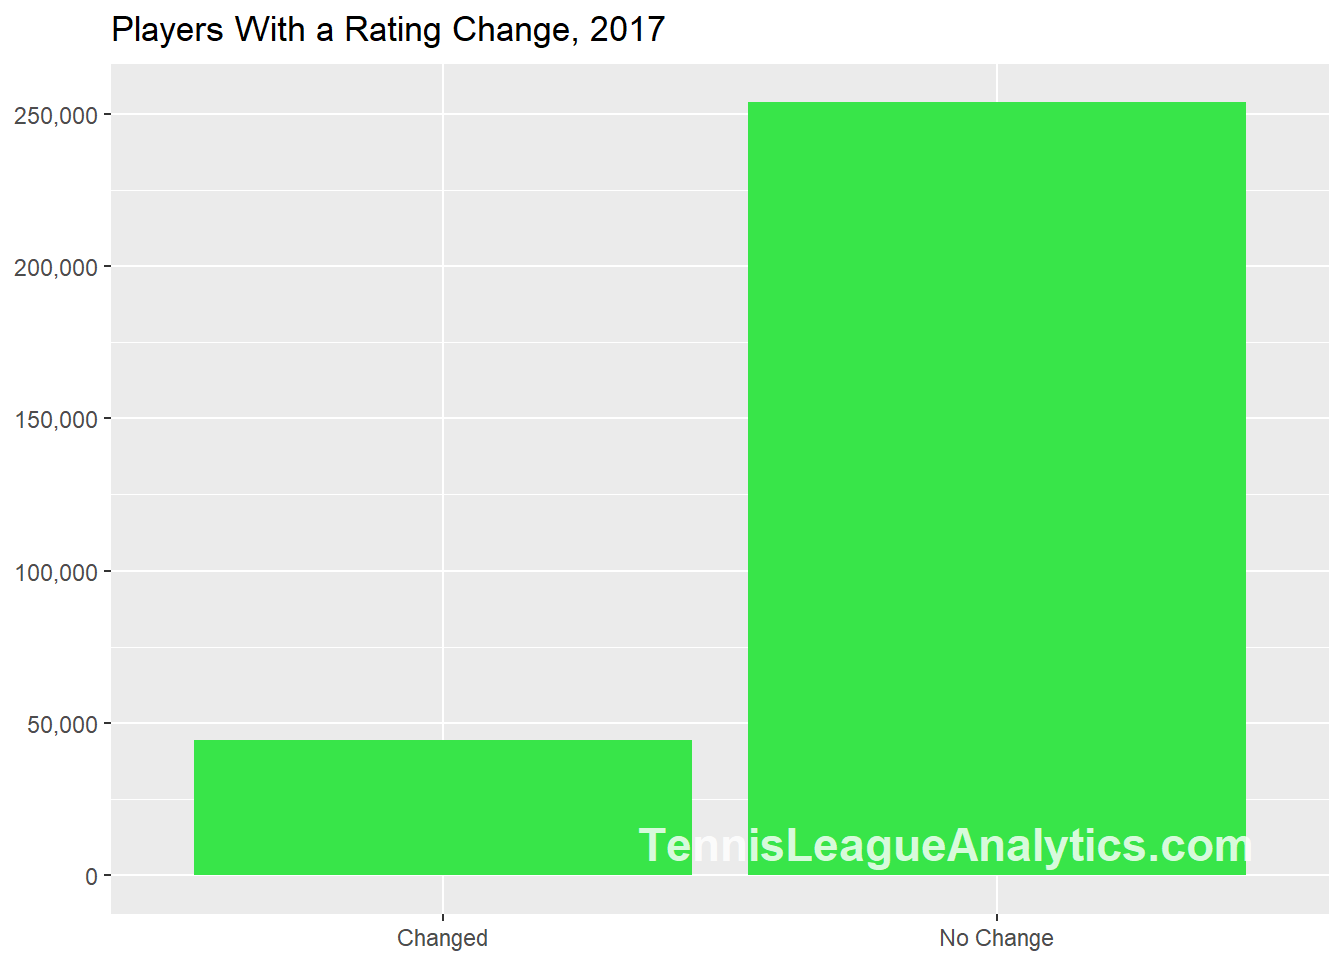
About 44,000 players of the 300,000 that played in 2017 had a rating change - either a bump up to a higher NTRP level or a bump down to a lower level. This is about 15% of all players.
Now let's see how many players moved up and down, and whether anyone moved more than one NTRP rating level.
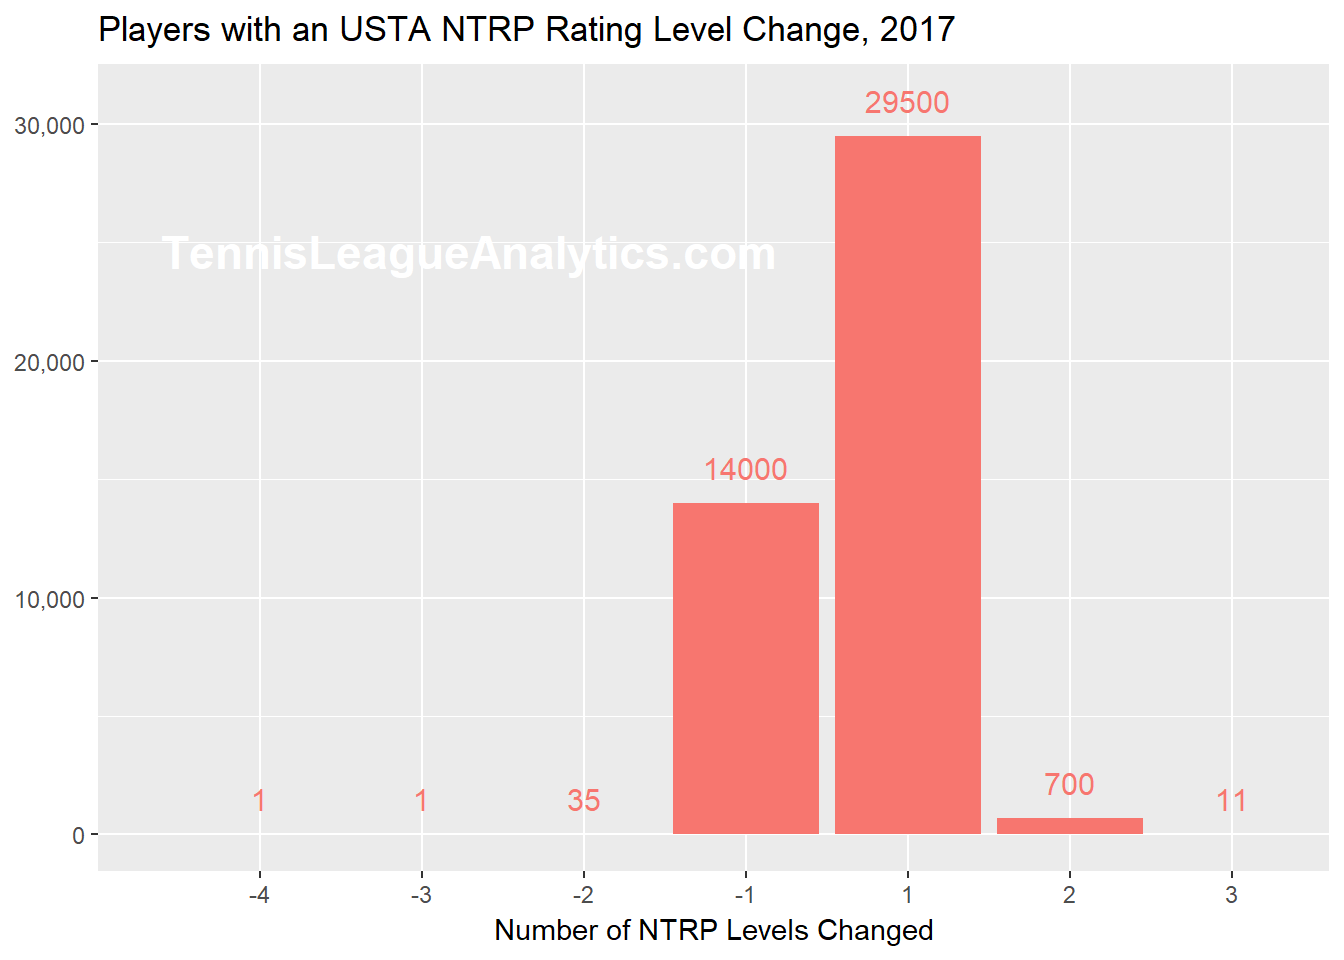
The graph shows how many players were bumped up or down by how-many levels. For example, the "-1 " means a player dropped one level. This could have been, for example, from 4.0 down to 3.5, or 3.5 down to 3.0.
Several things stand out. About twice as many player went up one level than went down one level. Does this mean there is rating level inflation? Or that players gets better over time?
It's interesting to see that 700 players were bumped up 2 levels but that only 35 went down 2 levels. Next week we'll look into how many bumped up players were self rated.
We'll also look at whether some Sections have more than their fair share of level changes.
If you like this type of info, let your tennis friends know about TLA. Email your questions or contact us via Twitter or Facebook.
Follow us on Twitter, Facebook, or subscribe to our mailing list for updates.
Where do you rank in USTA matches played?
Part 4, USTA Adult Tennis League by the Numbers, 2017
We've had several questions along the lines of "Where does my number of matches played rank?" This post will focus on this one question.
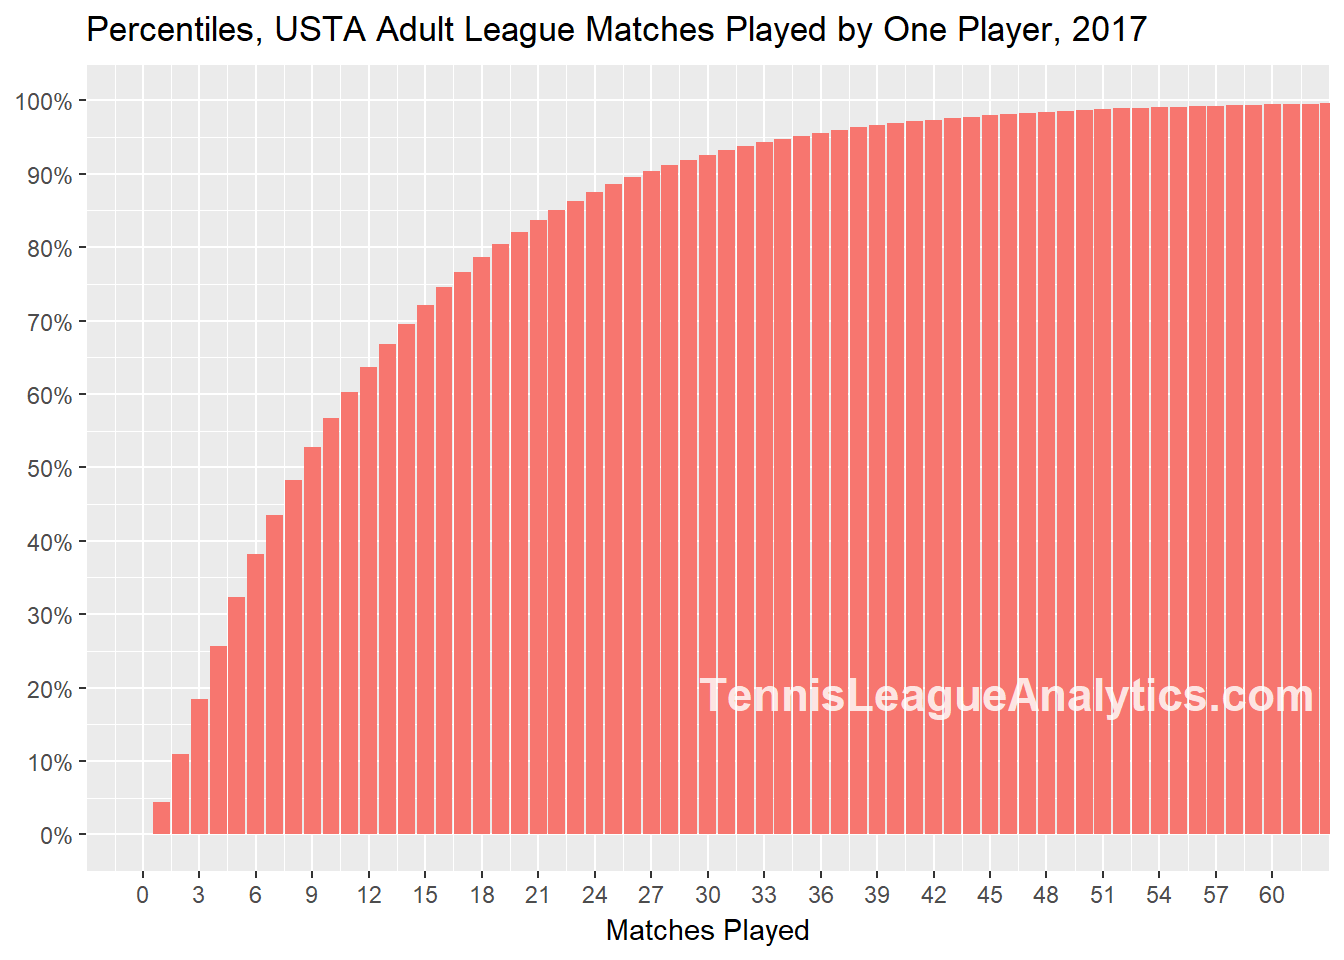
This might look complicated but it's really very simple.
To answer the question, "Where do I rank?", count or estimate the number of USTA league matches you played in 2017. Then look across the bottom for your number. Then follow the bar straight up to see what percentile you're in. The percentile is the number on the left side.
For example, if you played 9 matches, you are in the 53rd percentile, which means you played more matches then about half of all USTA League players. If you played 20 matches, you are in the 83rd percentile. To rank in the top 10%, you need to have played 27 matches.
And to be a One Percenter requires that you played 54 USTA tennis league matches. About 3,000 players did this. It would be nice if the USTA gave those players recognition. I don't know if they will, but Tennis League Analytics will give the first 10 One Percenters who contact us before February 21 a free Player Strength Rating Report.
By the way, the chart does not show the 700 players that played more than 70 matches. Just image that the Matches Played numbers at the bottom keep going to 223 and the bars are all pegged at 100%. If you want to see how many matches the top 30 players played, look at the previous post.
We'll keep it short today. We will continue these types of posts throughout February. Email your questions or contact us via Twitter or Facebook.
Follow us on Twitter, Facebook, or subscribe to our mailing list for updates.
Who plays the most USTA Matches?
Part 3 in USTA Adult Tennis League by the Numbers, 2017
Last week we were asked, "What's the most number of matches played by one player?" So in part 3 of USTA Adult Tennis League by the Numbers we'll answer this by section and nationally.
Previous posts in this series showed that about 300,000 adults played USTA league matches in 2017. The average number of league matches played: 12.4.
Let's see how the average number of matches differs by USTA Section.
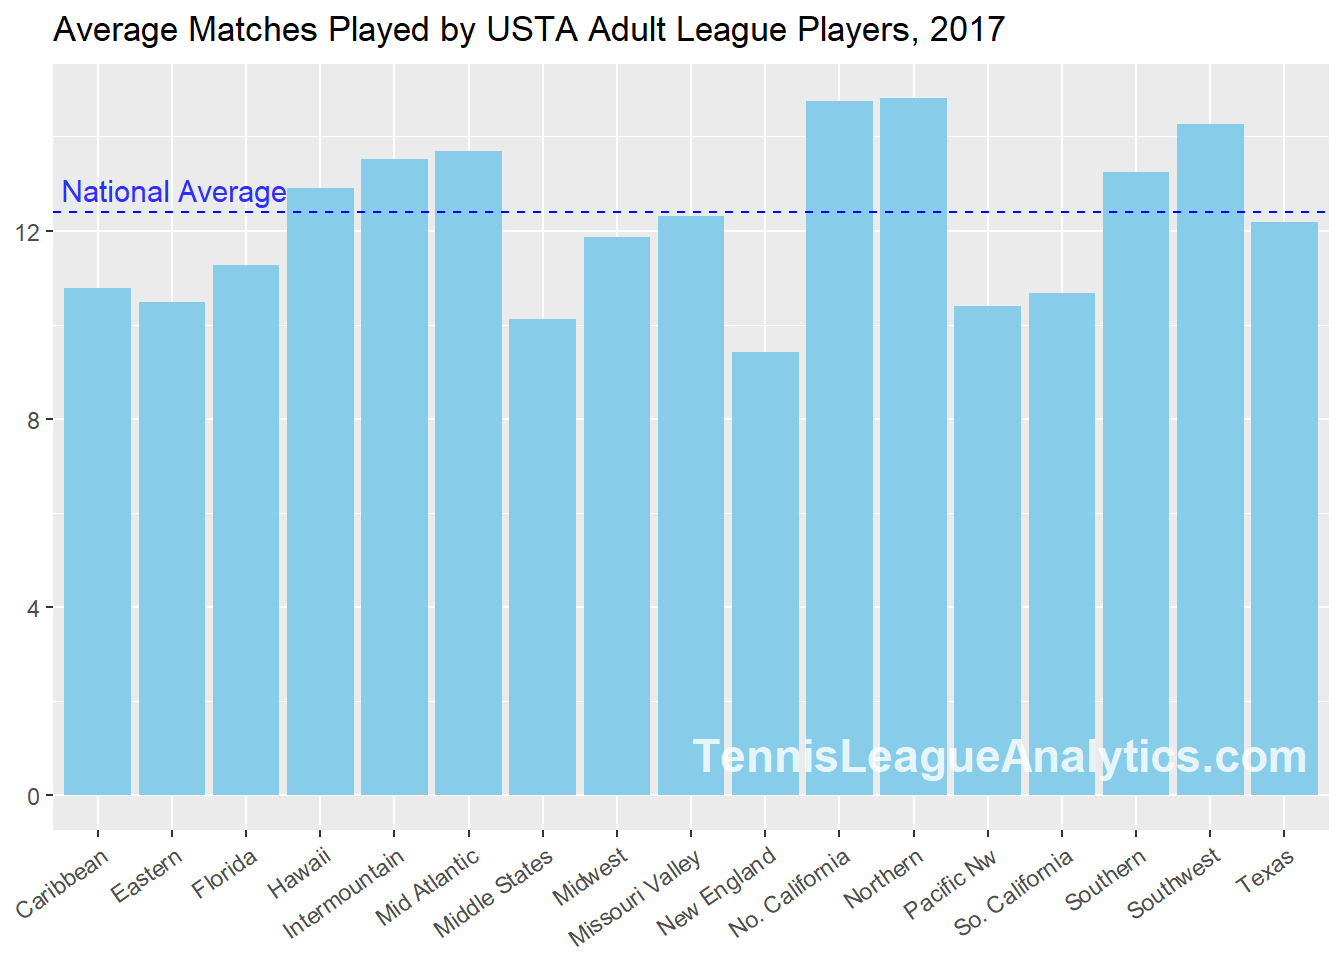
The Northern, No. California, and Southwest Sections lead the way with the highest average number of matches played by adult USTA player. At first glance, Northern at number 1 seems surprising. The weather is not conducive to year-round tennis. Northern is a small section. You can see this in a USTA section map from our June 18, 2017 post here.
Because Northern is small relative to the other sections, its average can be influenced by a few players that play a lot. The median may be a better indicator. The median is the number in the middle - half the players played fewer, and half played more. Let's see.
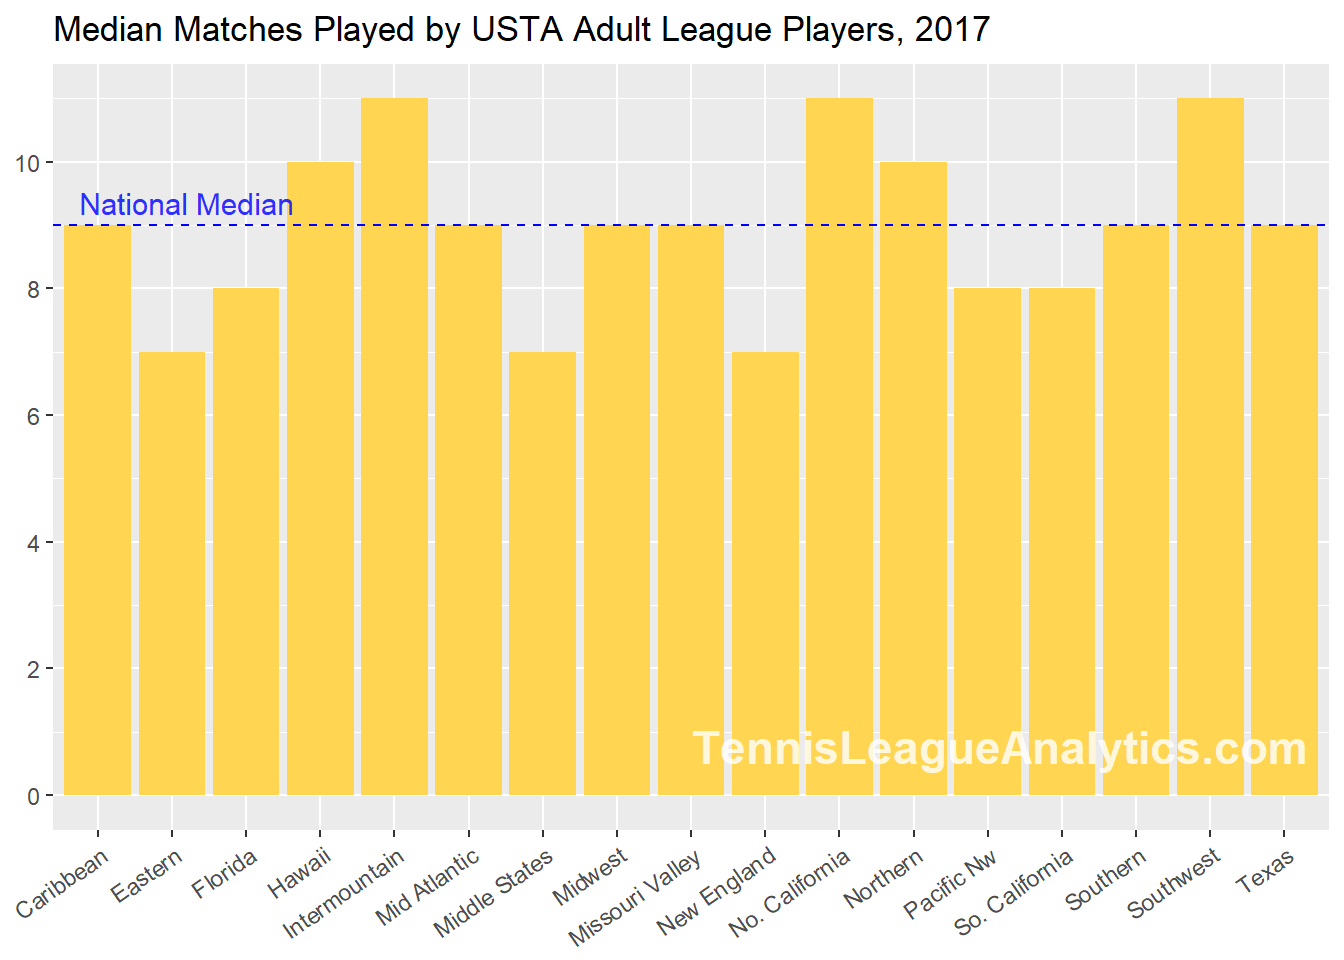
The median for Northern is smaller than its average, but the same is true for all the sections by 2 to 5 games. This means that the average is pulled up by some players that play a lot of matches. Let's see the largest number of matches played by one player in each section.
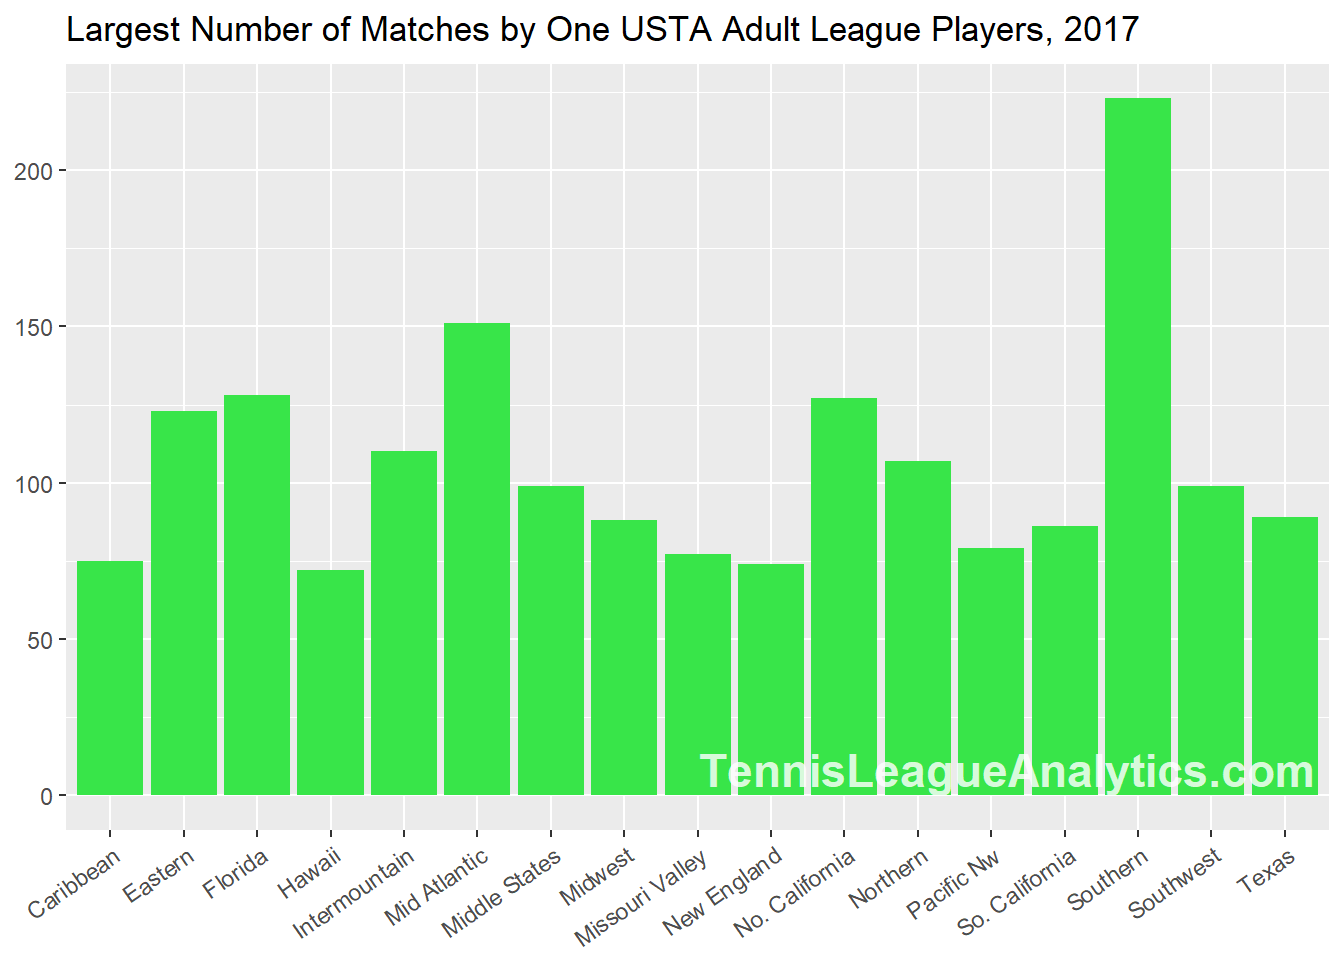
This is impressive. The most matches played by one player in each section ranges from approximately 75 to 225. Wow. Let's look at the top 30 number of matches played by one player.
| NTRP | Section | Matches Played |
|---|---|---|
| 4.0 | southern | 223 |
| 4.0 | southern | 193 |
| 3.0 | southern | 166 |
| 3.5 | southern | 158 |
| 3.5 | southern | 158 |
| 3.5 | southern | 158 |
| 3.0 | southern | 152 |
| 3.5 | mid atlantic | 151 |
| 3.5 | southern | 141 |
| 4.0 | mid atlantic | 140 |
| 4.0 | mid atlantic | 140 |
| 3.5 | southern | 134 |
| 3.5 | southern | 133 |
| 3.5 | southern | 130 |
| 4.0 | southern | 129 |
| 3.5 | florida | 128 |
| 4.0 | no. california | 127 |
| 4.0 | mid atlantic | 126 |
| 4.0 | southern | 125 |
| 3.5 | mid atlantic | 124 |
| 3.5 | eastern | 123 |
| 4.0 | southern | 121 |
| 3.5 | mid atlantic | 118 |
| 4.5 | mid atlantic | 117 |
| 3.5 | southern | 117 |
| 4.0 | southern | 115 |
| 3.0 | southern | 115 |
| 4.0 | southern | 114 |
| 3.5 | southern | 113 |
| 3.5 | southern | 112 |
Which turns out to be:
| Section | Count |
|---|---|
| Southern | 20 |
| Mid Atlantic | 7 |
| Eastern | 1 |
| Florida | 1 |
| No. California | 1 |
We'll continue these types of posts throughout February. Email your questions or contact us via Twitter or Facebook.
Follow us on Twitter, Facebook, or subscribe to our mailing list for updates.
USTA Adult Tennis League 2017 by the Numbers, Part 2
How many players are in each NTRP Level?
This is the second installment of our blog series on interesting USTA tennis league statistics from 2017.
Let's look at how many of the approximately 300,000 adult league players were in each NTRP level at the end of 2017.
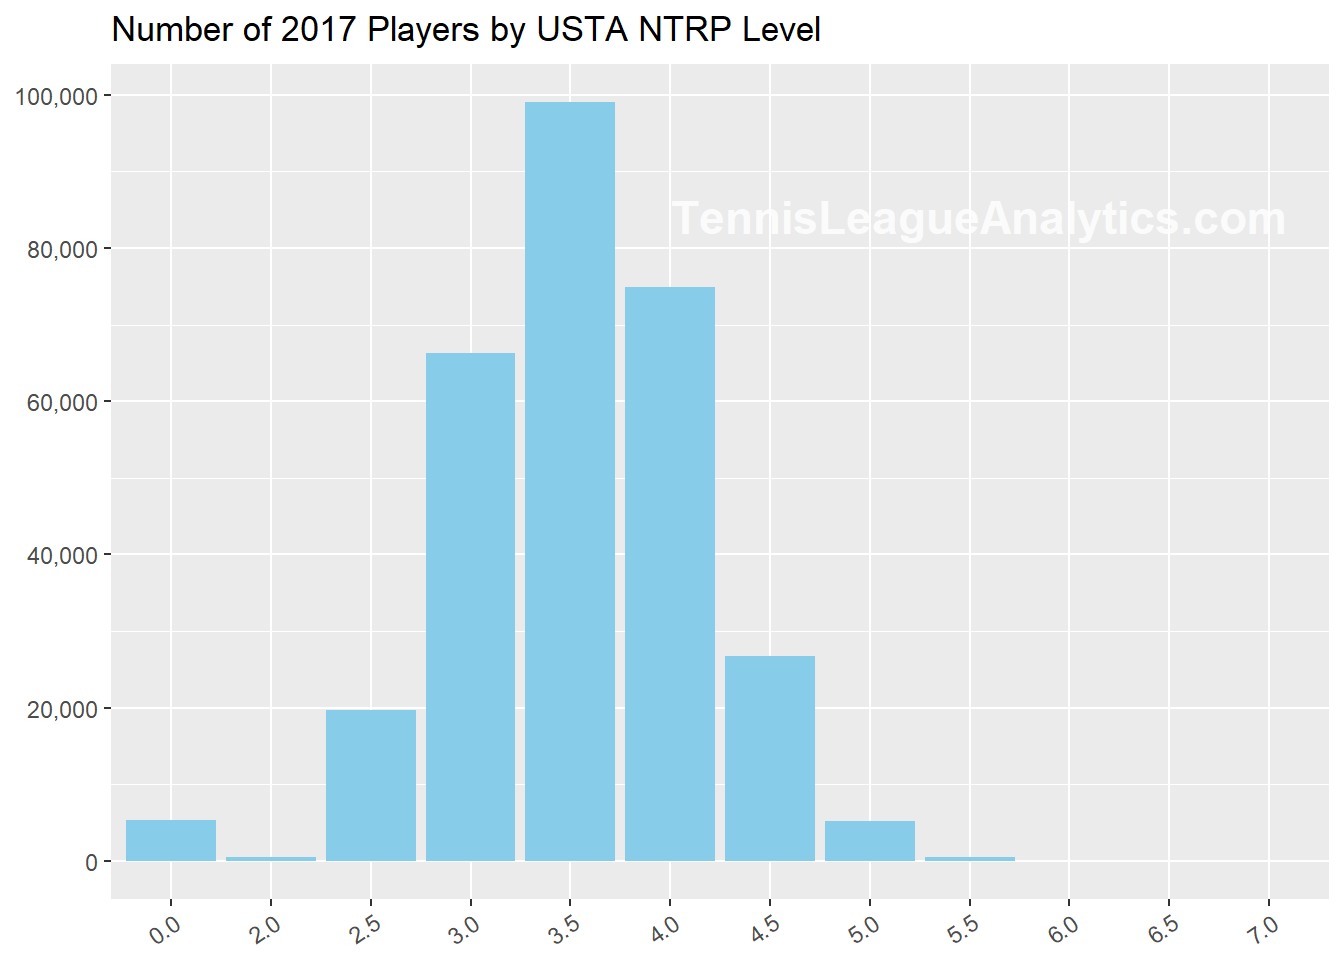
You might notice a few curious things in this chart. What's with the NTRP Rating of 0.0? We researched this and it appears that the USTA assigns a 0.0 NTRP rating to players who have not played enough matches to keep a Computer rating. Those players must self-rate for the new season. In this case, for the 2018 Season. The USTA has a FAQ page about these types of things here though the 0.0 Level is not explicitly mentioned.
There are no league players at 1.0 or 1.5. And while 6.0, 6.5, and 7.0 appear empty, there are, respectively, twelve, six, and nine players at those levels.
In terms of percentages, here's an easy way to look at the numbers:
Percent of USTA Adult League Players by NTRP, Year-End 2017
Ignoring the NTRP 0.0 Level
| NTRP Group | Percentage |
|---|---|
| 3.0 and below | 31% |
| 3.5 | 34% |
| 4.0 and above | 37% |
Roughly, one-third below NTRP 3.5, one-third at 3.5, and one-third above 3.5.
A 4.0 player is in the top 37% of players. A 4.5, top 11%. And a 5.0, top 2%.
We'll continue these types of posts throughout February. Email your questions or contact us via Twitter or Facebook.
Follow us on Twitter, Facebook, or subscribe to our mailing list for updates.
USTA Tennis League 2017 in Review, Part 1
2017 By the Numbers
In 2018 Tennis League Analytics will again cover USTA Adult League Championship events and blog about the strongest teams by flights. Until then we'll look at interesting 2017 USTA League numbers.
Almost 300,000 tennis players participated in USTA league matches in 2017, which is about 12,000 more than in the previous year. The chart below compares 2016 to 2017 by Section. USTA Southern really stands out not just because of their sheer size but also because of their growth. WOW!
And would you have guessed that the next largest USTA section by players is the Midwest?
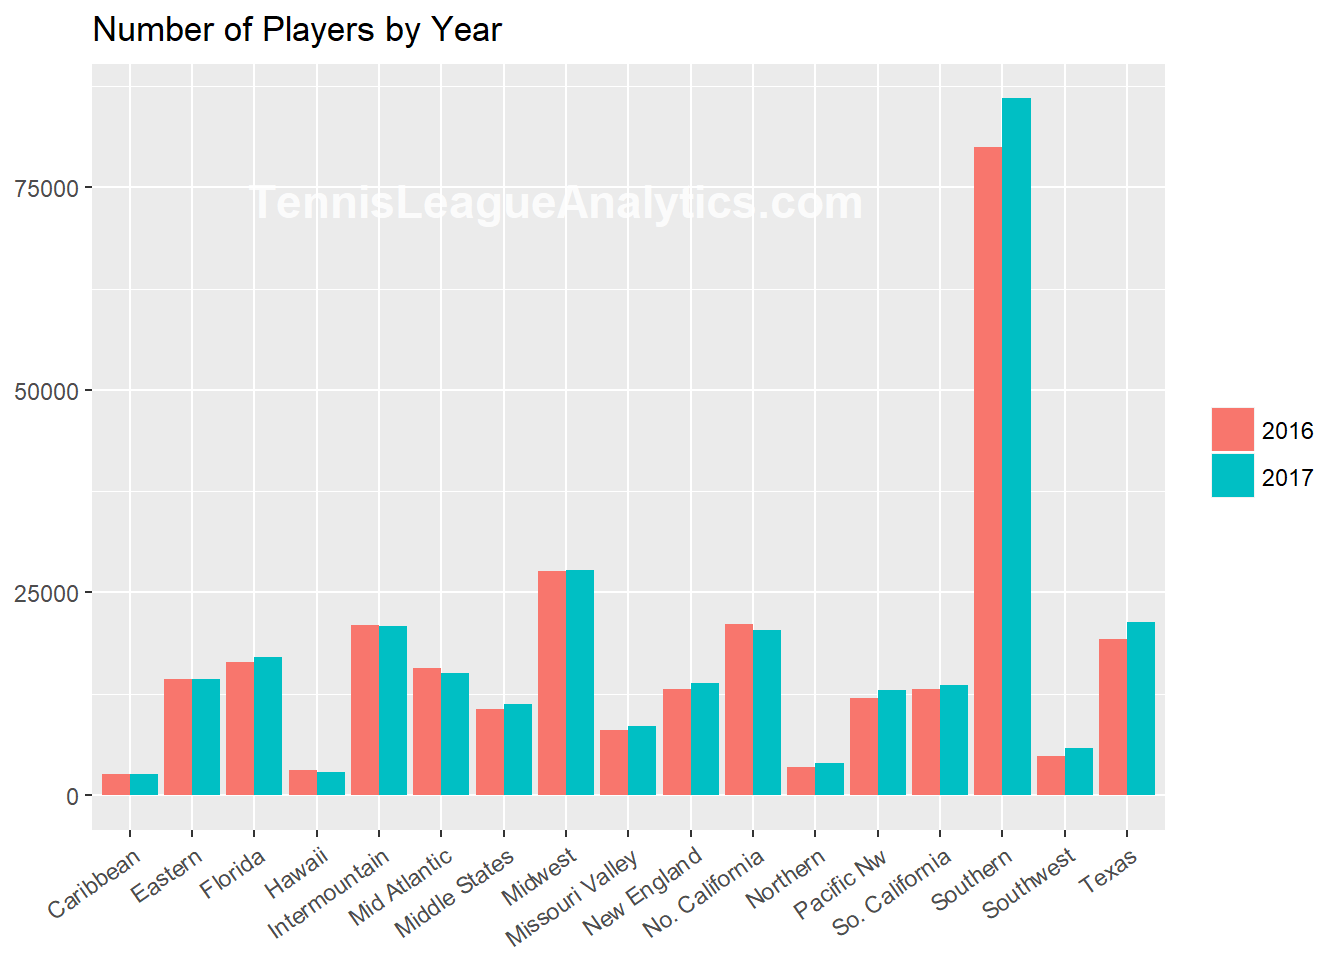
To see what these numbers look like on a USTA section map, check out the three maps that Tennis League Analytics posted last July - they appear on our blog archive here. The USTA section maps show counts that combine 2014 to 2017, but the proportions are similar to 2017's numbers.
These 300,000 USTA Tennis League Players competed in about 1.25 million USTA League matches. The next chart shows the split of singles versus doubles. About three doubles were played for every singles match.
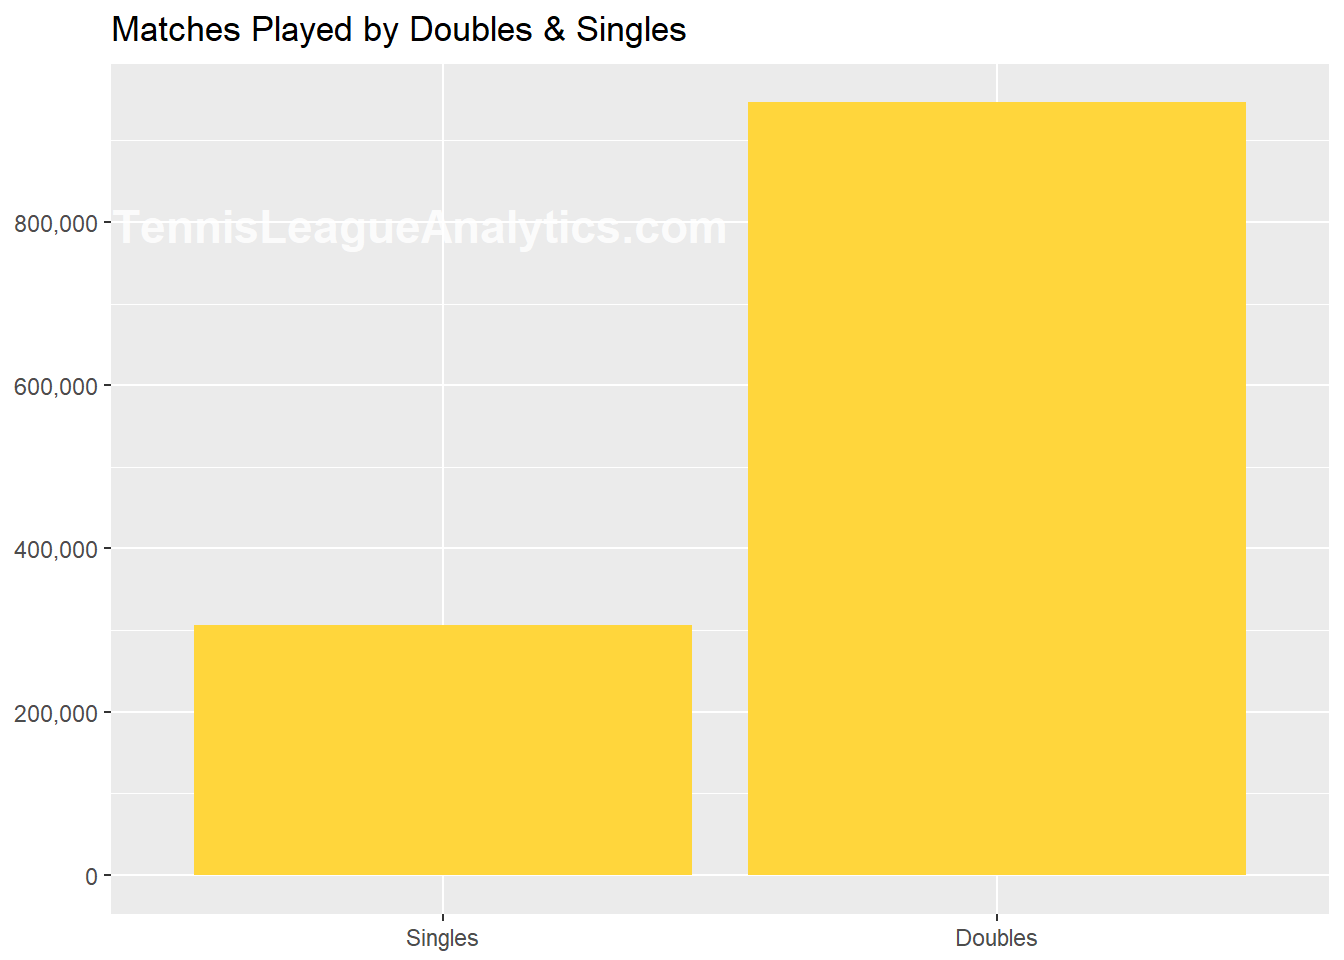
The average number of matches played by a 2017 USTA Adult League player: 12.4. How many did you play?
We'll continue to look at more stats next time. Do you have interesting question?
How about the top-ten list of most matches played by a player? Statistics by gender? How many players were bumped-up? Were any players bumped up by more than one NTRP rating level? Which USTA Section has the highest average rating?
Send us a tweet or post on our Facebook page.
Follow us on Twitter, Facebook, or subscribe to our mailing list for updates.
Get ready for 2018 USTA Tennis Leagues
All 2017 and 2018 Early Start Matches updated!

All Tennis League Analytics reports have been updated with all 2017 Season and 2018 Season (early start) matches played through 12/31/2017.
Captains have been ordering Flight Scouting, Team Player Trend, and Appealed and Self-Rated Player Reports to get a jump on their opponents.
We are offering club pro's and tournament directors one free tournament seeding service. We are limiting this to one per USTA District or Area on a first-come basis and for a limited-time. See our previous post for more details.
While we wait for 2018 Championship events to start, we'll blog about interesting USTA Tennis League Statistics. If you have an interesting question about USTA Tennis Leagues, email us. We might use your question in a blog.
Follow us on Twitter, Facebook, or subscribe to our mailing list for updates.
Tennis Club Tournament Draw and Seed Services
TLA Player Strength Ratings Make Tournaments More Fun and Fair!
Tennis League Analytics now offers club tennis tournament draw services. Send us a list of the adult players and the structure of the tournament and we will create the draw based on our Player Strength Ratings, which are based on statistics from USTA league results.
Tennis club pros and tournament directors no longer need to waste their valuable lesson and management time putting together and defending bracket draws and seeds for club tournaments. For $2 to $3 a player, TLA can provide you with an objective and transparent bracket for any type of tournament.
For example, a venue hosts a club championship or charity event tournament with brackets for USTA NTRP 3.0, 3.5, 4.0, and 4.5 singles and doubles. The 4.0 brackets attracts 24 entries. The tournament director knows 8 players and then has to ask around or guess about the strength of the other 16. And even if the tournament director takes the time to consider each player individually, the evaluation may not be accurate. Pick the wrong top seeds and you may impact the number of entries next year.
Tennis League Analytics can minimize the guesswork and time involved in creating the draw. We'll provide you with a list of the players sorted by their TLA Player Strength Rating. Players that have not played a USTA match in the last two years will still need to be estimated but those will be relatively very few.
Another example would be a fun tournament that consists of 16 teams of 6 players - 3 men and 3 women. The club tournament director now has to assemble this collection of 96 players whose NTRP ratings range from 3.0 to 5.0 into 16 teams of equal strength. How many hours will this task consume? Will everyone feel the teams are fair? Save time, money, and frustration and hire TLA.
TLA has an algorithm that will optimize the teams so that the combined strength of a team's players are as evenly balanced as possible. The tournament director could even publish the rating of each team for complete transparency.
Look on our Players Reports page for more information.
Follow us on Twitter, Facebook, or subscribe to our mailing list for updates.
Christmas Gifts for USTA Tennis Players and Team Captains
Save 25% to 36% on our Gift Combo Packs
Need a Christmas gift for the USTA tennis league player or captain in your life? Discounted combo packs now available on our Team Reports and Player Reports pages.
Follow us on Twitter, Facebook, or subscribe to our mailing list for updates.
Cyber Monday
Save 33% on our Cyber Monday Combo Pack
You'll receive one League Flight Scouting Report and one Team Player Trend Report. Get ready for USTA Winter Leagues.

Holiday Specials
We will have year-end gift specials for the tennis players in your life. Follow us on Twitter, Facebook, or subscribe to our mailing list for updates.
Cyber Monday, Christmas, and Holiday Specials
Player Ratings now include matches up to 11/1/2017
NTRP year-end ratings should be published by the USTA by November 30. If you are putting together 2018 Winter league teams and want the latest player ratings, please order early. The number of orders have reached a point where they sometimes take a few days to fill. And yes, we have reports which indicate which players are most likely to move up or down for those captains that are recruiting.

Holiday Specials
We will have year-end gift specials for the tennis players in your life. Follow us on Twitter, Facebook, or subscribe to our mailing list for updates.
Player ratings have been updated for matches played up to November 1, 2017.
Intermountain USTA 40 & Over Scouting Recap
Top rated teams win 5 of 6 Sectionals.
The USTA Intermountain 40 & Over sectionals wrapped up this weekend in Denver, CO. The teams with the top Tennis League Analytics (TLA) scouting report ratings once again won the majority of the championships.

Intermountain Sectional Championship - 40 and Over:
TLA’s top rated team won 5 of the 6 championships. In the sixth event, our #2 and #3 finished first and second.
Congratulations to the new USTA section champions!
Our schedule has been impacted by Hurricane Irma. We’re trying to catch up.
Intermountain Sectionals Scouting Reports
40 & Over 3.5, 4.0, and 4.5
USTA Intermountain Section Championships for Adult 40 & Over 3.5 - 4.5 take place September 15 - 17 in Denver. CO.

All the teams are very good and any team has a chance to beat any other team. Tennis League Analytics ranks these teams as the strongest in their flights.
40 & Over
Women’s 4.5
5 teams in one flight
Top teams:
1. Utah
2. CO1
3. CO2
The two CO teams are neck-and-neck but the UT team is stronger.
Women’s 4.0
6 teams in one flight
Top teams:
1. CO
2. NV
3. UT
CO’s doubles strength looks amazing.
Women’s 3.5
6 teams in one flight
Top teams:
1. CO
2. UT
3. ID
CO and UT are the teams to watch with CO having an edge.
Men’s 4.5
4 teams in one flight
Top teams:
1. ID
2. CO
ID is very strong in doubles and has a good edge in overall team strength rating. CO is a much more balanced team. Smart line-ups will be key.
Men’s 4.0
5 teams in one flight
Top teams:
1. CO
2. NV
3. UT
CO has a pretty good lead in strength rating with NV and UT separated by a few thousandths of a point.
Men’s 3.5
4 teams in one flight
Top teams:
1. UT
2. CO2
UT’s singles players separate the top two teams.
Flight Scouting reports are available on the Team Reports page for championship events and local leagues. A sample report is available at this page. Tennis League Analytics can help your USTA team with all of its tennis league stats needs.
We took a break for Labor Day and then Hurricane Irma forced another break. Thank you coffee shop wifi for helping us get this report out.
Blog Archive
Looking for a blog post showing the top teams at a previous USTA Sectional Championship?
Or perhaps some of our in depth analysis on what types of teams win USTA matches?
Click Here for our Blog Archive